INTRODUCTION
The health and survival of coral reefs is a major concern in a future with a warmer ocean. These reefs occur in the tropics and subtropics on continental (Great Barrier Reef, Florida Keys) and large island shelves (New Guinea, Madagascar), as well as at small oceanic islands and atolls that are removed from continents and most of humanity. For the latter group, the outer reefs usually face the deep ocean and drop steeply, so adjacent ocean water is continually in contact with them and imports the dynamics of upper ocean thermal structure evidenced by internal waves and upwelling measurable on the outer slope.
Current ocean warming concerns for coral reefs largely focus on bleaching, the condition where the symbiotic zooxanthellae algae found inside the cells of coral polyps are expelled, leaving the tissue largely colorless and the white coral skeleton visible. Thermal stress is usually the cause of bleaching, and without their symbionts, the colonies die within a few days to weeks. If thermal stress is relieved by water temperatures decreasing below a threshold level, the corals can reacquire their zooxanthellae and recover. Other factors are of concern to long-term reef health, such as ocean acidification, land-based pollution, and overfishing, but they pale in comparison to the immediate specter of bleaching. Bleaching events spanning the global tropics began in 1997–1998, and were observed more recently in 2010 and again in 2014–2016; as they apparently are becoming more frequent, reefs have less time to recover between them (Hughes et al., 2018).
“Combined with other types of information…the detailed breakdown of temperature is important when evaluating the actual thermal environments where reefs exist, and provides a needed counterbalance to and accuracy check on [satellite sea surface temperature] observations.”
The data used to examine global level ocean temperature dynamics come from remote measurements made via satellite radiometers (infrared and microwave) and in situ instruments on drifting buoys, Argo floats, transiting ships, and other platforms (Hausfather et al., 2017). The presence of isolated reefs and islands in areas presently without monitoring instruments or undersampled by Lagrangian systems such as Argo suggest the potential for using these locations as “ocean stations” by instrumenting them to examine ocean temperature, warming on reefs in particular. The central-western Pacific has many islands/reefs suitable for this purpose, and some efforts are already underway at Palmyra Atoll (the Line Islands Palmyra Atoll Research Station), Moorea (French Polynesia’s Gump South Pacific Research Station), Pohnpei (in the Federated States of Micronesia; Sonia Rowley, University of Hawaii, pers. comm., 2018), and Palau (reported here). More locations are needed.
The island nation of Palau, the westernmost island in the Caroline chain, lies within the western Pacific warm pool (Figure 1a). This article examines ocean thermal conditions there over the last two decades. Palau is known for its coral reefs and for a high diversity of marine habitat types in a relatively small area (Colin, 2009). Numerous islands in the main group at 7°N all occur within a barrier/fringing reef margin where healthy reef systems have differentially recovered from 1998 and 2010 bleaching events (Golbuu et al., 2007; van Woesik et al., 2012). The main islands/reefs (Figure 1b) are located at the interface between the westward-flowing North Equatorial Current (north of Palau) and the eastward-flowing North Equatorial Countercurrent (south of the main islands). The two currents move north to south relative to one another seasonally and also shift latitude with changes in El Niño-Southern Oscillation (ENSO; Hsin and Qui, 2012). Several small oceanic islands and one atoll belonging to Palau, collectively called the “southwest islands,” lie in the area between the main group and the northern coast of New Guinea. They can serve as additional ocean stations for monitoring temperatures in current regimes that are different from those in the main island group.
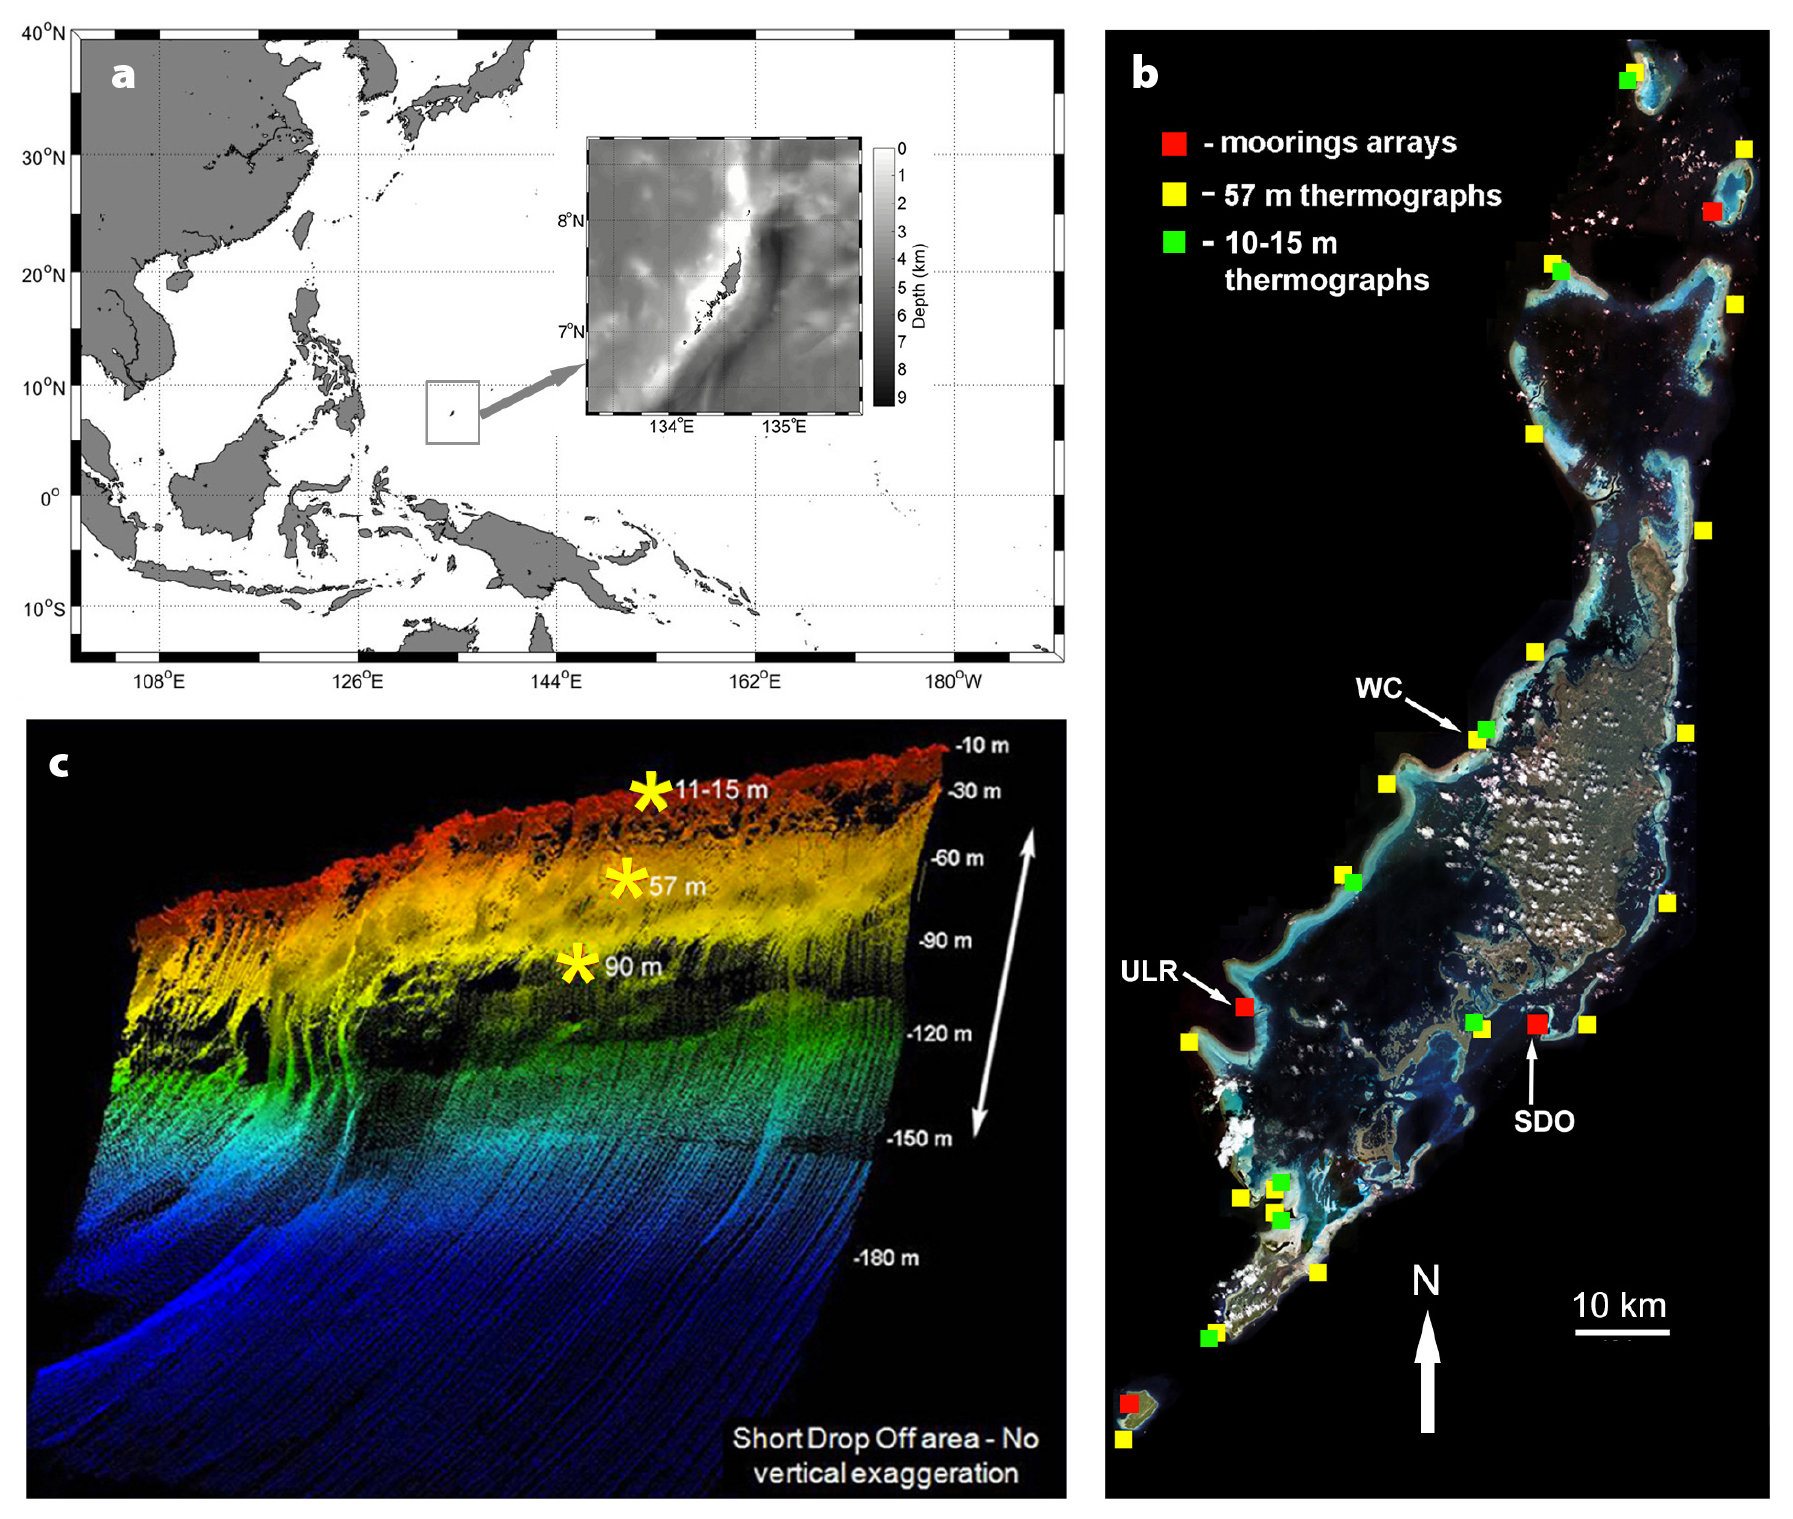
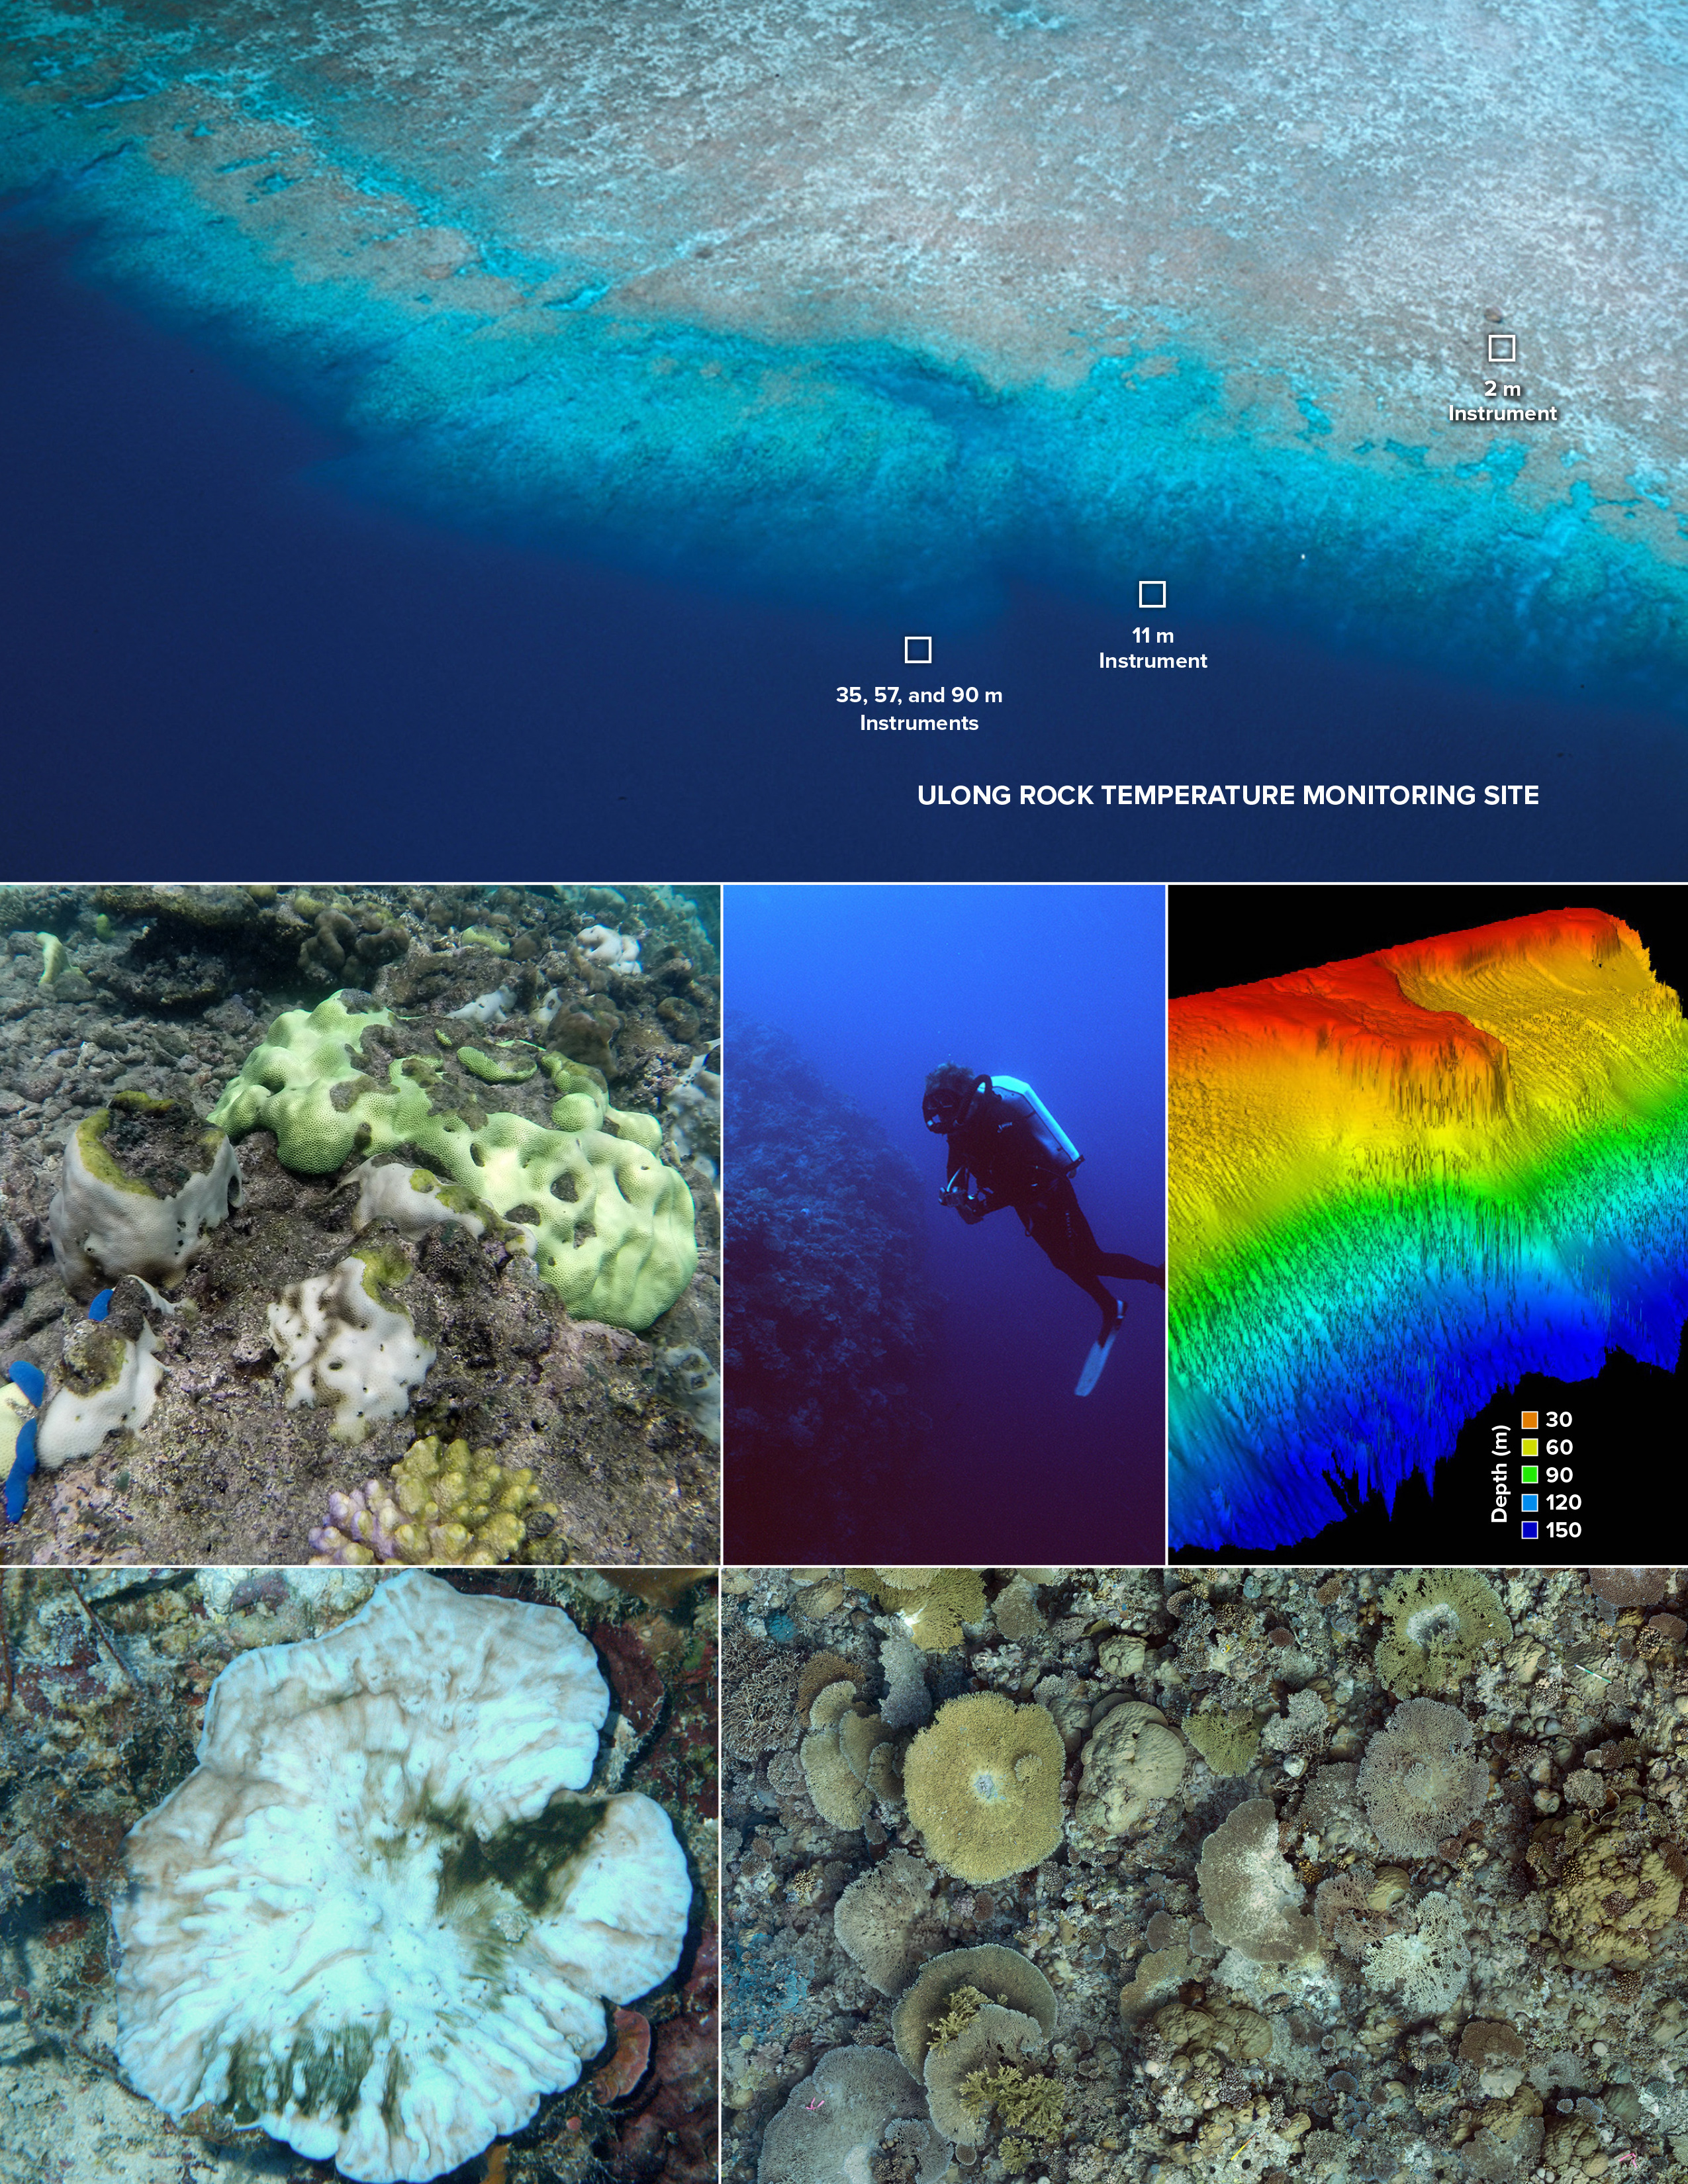
Figure 1. (a) Location and general bathymetry of Palau. (b) Satellite image of Palau showing locations of the outer reef thermograph network throughout the main reef tract. Ver-tical arrays of instruments (2–90 m depth) are shown by red squares, 57 m stations by yellow squares, and other outer reef 10–15 m stations by green squares. SDO = Short Drop Off. ULR = Ulong Rock. WC = West Channel. (c) Multibeam sonar image (no vertical exaggeration) of the SDO slope showing near vertical profiles with locations of thermographs at 15, 57, and 90 m depths indicated. > High res figure
|
Attempts to examine coral-reef warming on a worldwide scale have relied almost solely on satellite data (Heron et al., 2016; Hughes et al., 2018), which provide a global perspective of conditions relative to coral bleaching at intervals of a few days. These remote measurements of the infrared or microwave spectrum radiating from the ocean’s “skin” provide satellite sea surface temperatures (SSST). However, they do not provide information regarding thermal conditions below the surface layer, and reefs and their corals can occur to depths of 100 m or more (Baker et al., 2016). Below the ocean/atmosphere interface, the effects of day/night and solar/atmospheric cooling and heating diminish, varying by location and weather, and the temperature where there is no diurnal change can only be measured with in situ instruments. In Palau, temperatures at depths of 10–15 m on outer reefs were found to be diurnally stable (Figure 2), and therefore are considered to represent local “foundation” values.
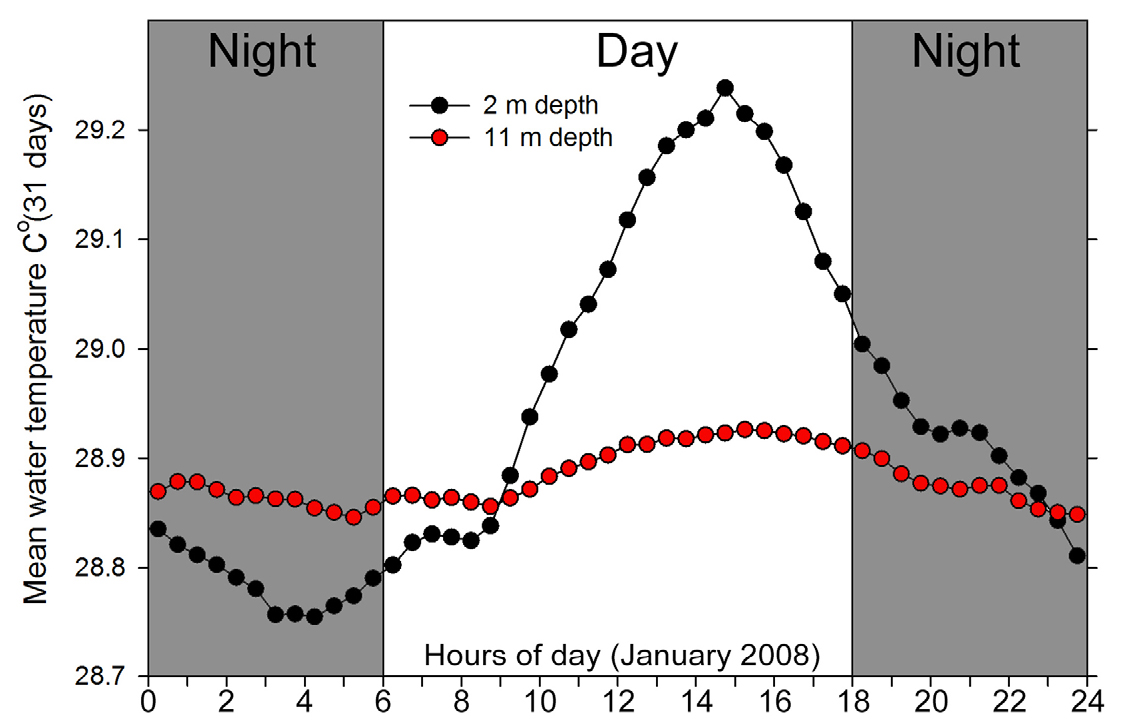
Figure 2. Validation of a “foundation” temperature depth (11 m) on the outer slope, Ulong Rock (western barrier reef). Data at 30-minute intervals from all days of January 2008. The nominal 2 m station is subject to diurnal variation as evidenced by increases during the day, peaking in the late afternoon, and decreasing below the 11 m temperature after midnight. > High res figure
|
When comparing remote-sensing data with those collected from in situ instruments, particularly recording thermographs placed directly on the reef for long periods, differences are often apparent for specific locations (Stobart et al., 2008; Castillo and Lima, 2010; Safaie et al., 2018). Data collected by in situ instruments provide a level of detail critical to understanding how different thermal regimes affect various reef habitats. These data also inform the broad applicability to bleaching considerations of remote-sensing information, which only offers average surface temperatures over kilometer scales. Within large reef tracts, temperatures are variable, and the sensitivity of individual coral species and communities are “spatially heterogeneous within reef scales (<1 km), and [are] therefore not predictable using conventional remote sensing products” (Safaie et al., 2018). A significant challenge is to obtain more detailed thermal data so the relationships between temperature and bleaching can be more clearly understood.
CORAL BLEACHING EVENTS IN 1998 AND 2010 SPUR AND VALIDATE TEMPERATURE MONITORING
Research at the Coral Reef Research Foundation (CRRF) in Palau began in 1995 with collection of marine invertebrates for screening by the US National Cancer Institute and documentation of the country’s biodiverse marine environments. Palau’s coral was extensively bleached during the 1998 La Niña, part of the 1997–1998 global ENSO event (Bruno et al., 2001; Colin, 2009), which was a shock as Palau had no prior record of significant bleaching. Earlier, very cool (for Palau) water (~17°–18°C) was found in deep reef areas during the late 1997 El Niño, but only nine months later, during La Niña, the same sites had temperatures of ~30°C from the surface to 90 m depth. Bleached and dying corals were observed throughout the water column, and on outer reef slopes mortality was 90% or more (Bruno et al., 2001). Surprisingly, at the same time, very shallow outer reef flats and many inshore reefs had much lower bleaching occurrence/mortality, with some communities appearing unaffected (pers. obs.).
The 1998 event prompted the installation of vertical arrays of calibrated thermographs (±0.1°C accuracy) to sample at 30-minute intervals from 2 m to 90 m depth along the east- and west-facing ocean reef slopes during 1999–2000 (Figure 1b,c). By the end of 2000, the warm oceanic conditions associated with bleaching had swung back toward cooler, slightly stratified ENSO neutral (Figure 3a). Starting in late 2001, water at depths below 35 m had major swings in temperature over timescales of minutes to weeks. At the deepest stations (90 m), temperature often changed 4°–8°C in half an hour, with individual values ranging between 8.6°C and 30.9°C. A year later (late 2002), the weekly mean temperatures at 57 m depth were 20°C, near the lower limit of reef growth, while at 90 m they were 15°–16°C, far below the lower limits of most reef coral survival (Kleypas et al., 1999). Adding to the general temperature stress were rapid shifts of several °C in minutes, exposing corals to even lower temperatures for varying periods.
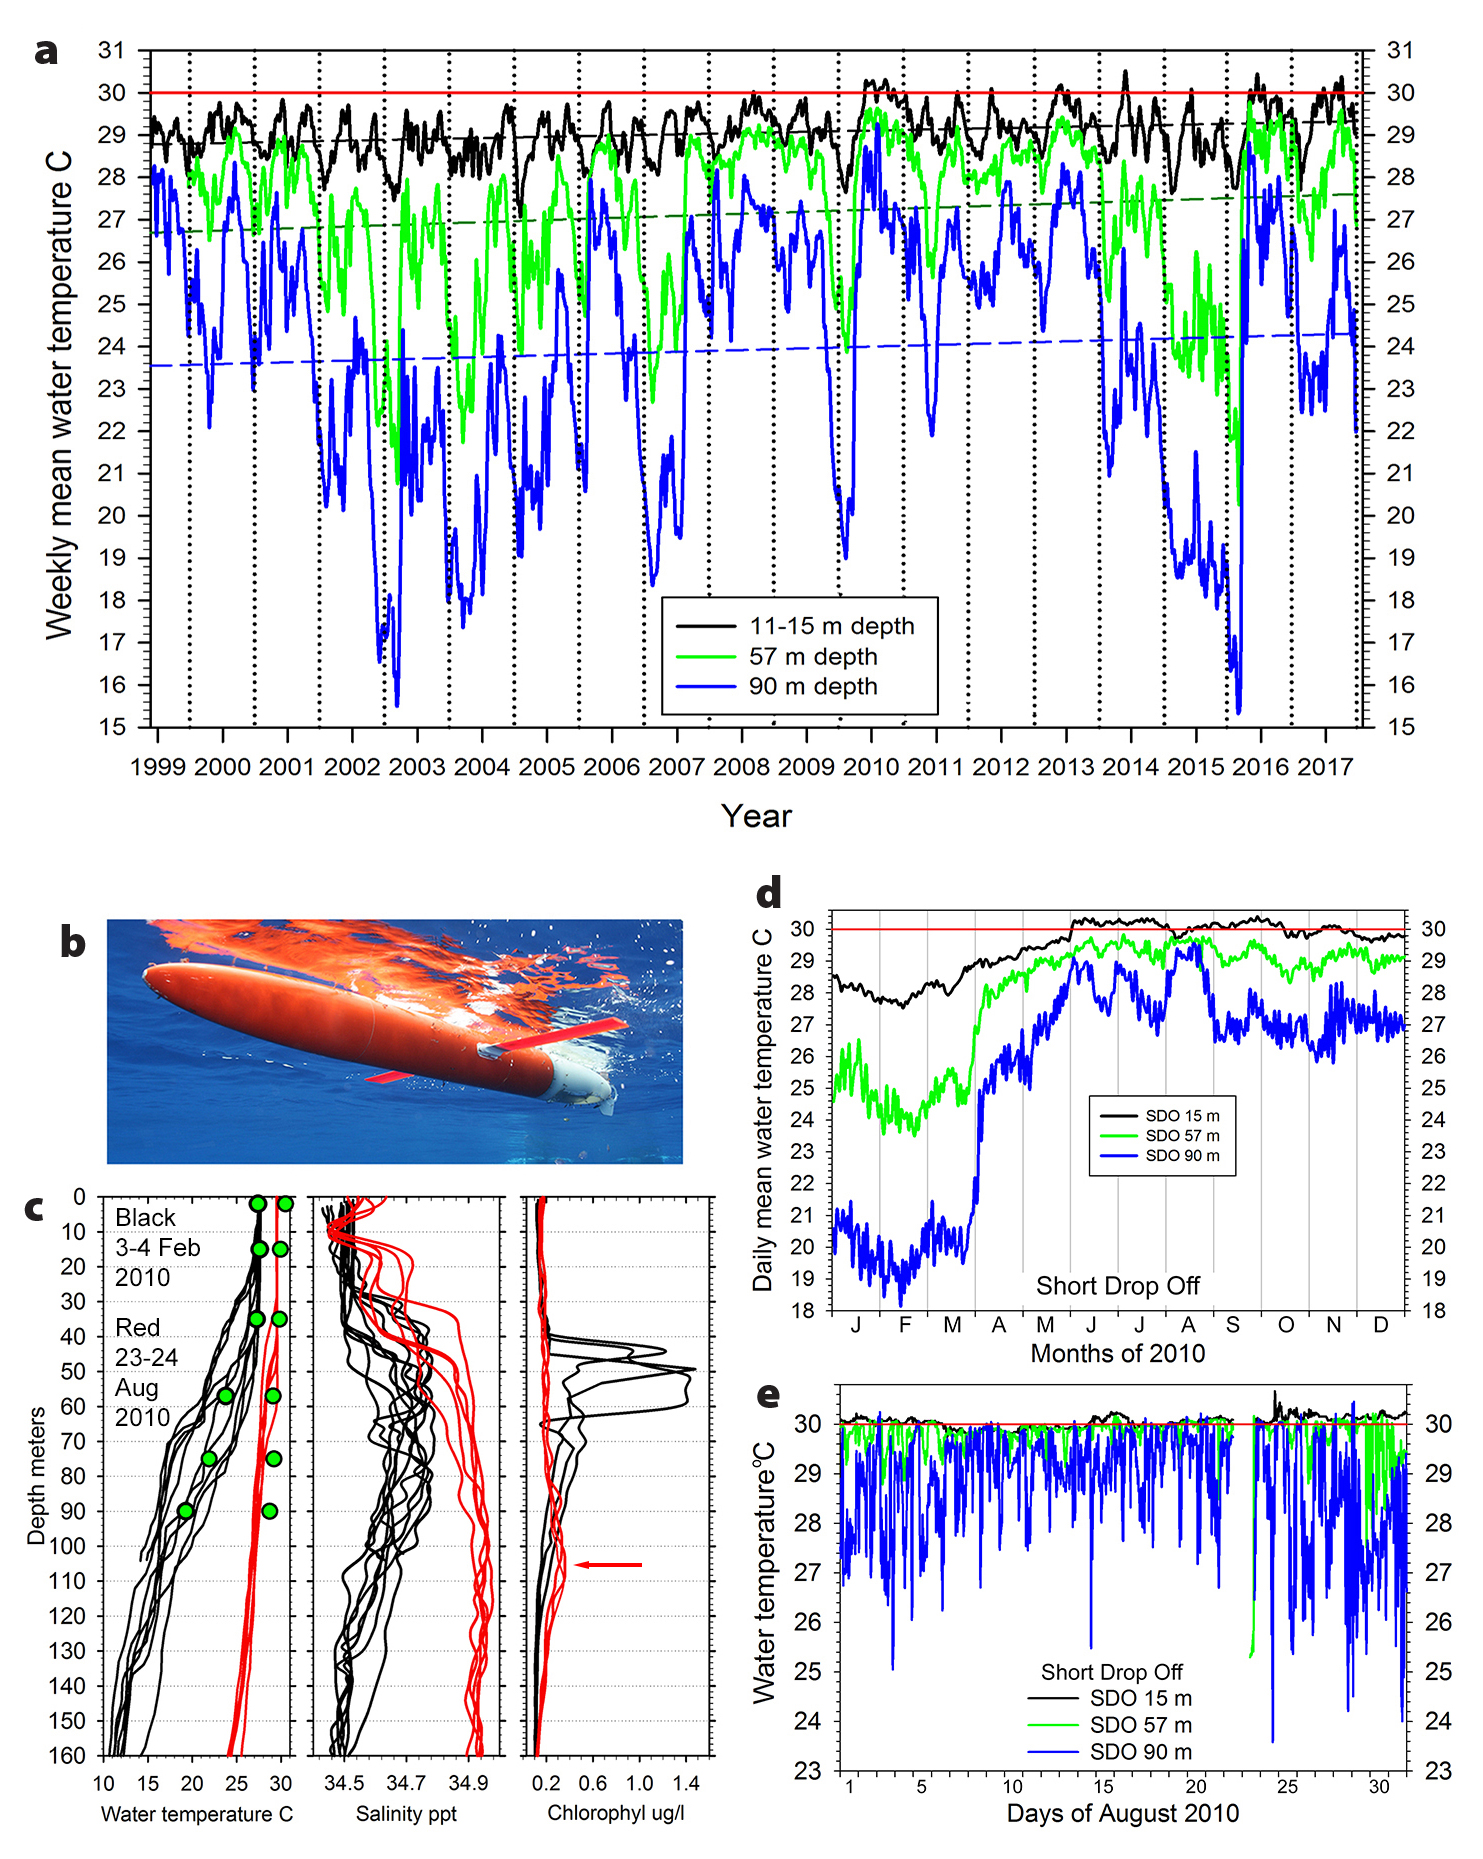
Figure 3. (a) Pattern of weekly mean water temperatures (MWT) on the outer slope of Palau, 1999–2017 at 15 m (black), 57 m (green), and 90 m (blue) depths. Straight-line regressions for all data at each depth are shown as dashed lines in respective colors. (b) View of the Spray glider used for profiling near the reef slope. (c) Spray glider profiles from February (El Niño) and August (La Niña) 2010 showing shifts in water column properties at that time. Mean temperatures over the same days at Short Drop Off and Ulong Rock stations (green circles) during the same time periods are shown. The red arrow indicates a faint peak in chlorophyll a in August. (d) Daily MWT at Short Drop Off (SDO) and Ulong Rock (ULR) during 2010. Red line indicates 30°C level beyond which bleaching may occur. (e) Detailed pattern of 30-minute water temperature measurements at Short Drop Off during bleaching event in August 2010. > High res figure
|
A preliminary report by Wolanski et al. (2004) showed general agreement in mean values between the east and west outer reefs and attributed much of the rapid temperature fluctuations to “island-generated” internal waves. Based on coral temperature tolerances, we suggested the lower limit of reef growth occurred at 60–70 m, with the stress of rapidly fluctuating temperatures potentially producing a “depauperate” zone in the 60–120 m depth range.
Over the next decade, the thermograph network was expanded throughout Palau to include some 60 sites and 145 instruments. It is now thought to be the most comprehensive temperature monitoring network on any single coral reef area. Stations address specific questions, such as upwelling, mixing, and advection, while still documenting thermal regimes in all environments (Figure 1b). The present 18-year record (Figure 3a) provides detailed quantification of the remarkable variations in temperature conditions relative to depth, habitats, and timescales. Such detailed data on variation for specific areas within single habitats are needed, as the variation may be the most critical factor for assessing coral bleaching risk within large reef systems (Safiae et al., 2018).
In 2010 another bleaching event occurred (van Woesik et al., 2012), and with instruments in place, the shift from El Niño to La Niña over six months (February–August) was well documented (Figure 3d). Profiling data from Spray ocean gliders (Rudnick, 2016) near Palau (Figure 3b,c) at the same time documented temperature conditions identical to the outer slope, while also providing additional information on salinity and primary production (Figure 3b) in the water column. February 2010 (El Niño) chlorophyll a data indicated dense phytoplankton at 40–60 m depths associated with mesophotic reefs, something previously undocumented in Palau. By August (La Niña), the chlorophyll a maximum decreased greatly and returned to more typical depths of 100–120 m.
Although shallow temperatures exceeded 30°C in June and July 2010, bleaching became more common in August when daily mean temperatures were highest at 90 m depth (pers. obs.; Figure 3d,e). While remaining near the temperature observed to induce bleaching, temperature increases stalled in August and increased slightly in September and during half of October, but reef conditions did not move into a bleaching event comparable to 1998. The 2010 La Niña is considered only moderate, not strong like the 1998 event (NOAA Climate Prediction Center ENSO), so the reduced occurrence/mortality from bleaching in 2010 is not surprising (van Woesik et al., 2012; pers. obs.). The daily mean values for nine outer reefs at 10–15 m depth (which are not affected by the tidal flow from the warmer lagoon) never exceeded 30.5°C. Bleaching was limited to sensitive habitats and species, such as the temperature sensitive Acropora table corals, but overall the mortality was limited and localized (pers. obs.). After mid-October, temperatures decreased slightly and then remained close to the 30°C level (Figure 3d).
THE QUASI-BLEACHING EVENT OF 2016
In mid-2013, deeper temperatures on outer slopes started decreasing rapidly (Figure 4a) while, concurrently, mean sea level (MSL) also dropped (Figure 4c,d), and by February 2016 the temperatures reached levels probably not seen since the 1997–1998 El Niño. Thermoclines were extremely shallow, and internal waves caused rapid daily temperature fluctuations at 15–57 m depth (Figure 4b). Temperatures were far below those associated with bleaching, and comfortably within the range for coral growth and survival. However, corals in very shallow and deep water did not fare well. Poorly understood “cold-water bleaching” was observed on the deep slope (Colin and Lindfield, in press). Conversely, on the shallowest reefs, the uppermost tips of branching corals, having grown ever upward during the relatively high MSL since 1998, were aerially exposed by a combination of low spring tides and low MSL (Figure 4c,d). Their upper reaches died and quickly become covered in algae (Figure 4e,f). The low monthly MSLs measured during El Niño, with values of 1,200-1,250 mm (Figure 4c), occur at intervals of several years and can stop or slow upward growth of reefs that were otherwise thought to be growing sufficiently to counter general sea level rise (van Woesik et al., 2016).
In early March 2016, both seawater temperatures and sea level dramatically and rapidly shifted in Palau, with temperatures rising at all depths (Figure 4a) and MSL rising rapidly (Figure 4c,d). Over the next 10 weeks, daily MSL rose at 7.5 mm per day and temperatures were racing toward levels that had the potential to induce massive coral bleaching and that could repeat the summer of 1998. However, in early June, the rise slowed as temperatures in shallow waters climbed just above the 30°C level, inducing bleaching only among sensitive corals. Temperatures then decreased, and bleached corals, rather than dying, quickly recovered. Modest thermal stratification had resumed by late summer. The extreme variation in 2016 provided a lesson in the variable and unpredictable conditions on western Pacific reefs, even in near-equatorial areas.

Figure 4. (a) Daily mean water temperatures at Short Drop Off from 2013 to mid-2017 at five depths. The red line indicates the 30°C bleaching level. (b) Water temperatures at one-minute intervals at Ulong Rock over 24 hours, March 6, 2015, during El Niño conditions with rapid changes in temperatures at given depths. (c) Daily mean sea level (MSL) as measured at Malakal Harbor tide gauge 1969–2017. Low and high peaks generally correspond with El Niño (low) and La Niña (high) in Palau. The green line shows the straight-line regression of daily MSL since 1969 with a very slow upward trend of 3 mm yr–1. (d) Expanded view of daily MSL, Malakal Harbor tide gauge from 2013 to mid-2017. Red arrows indicate stage of MSL when photos (e) and (f) below were taken. (e,f) Shallow reef flat area on the north side of West Channel (Figure 1b-WC) prior to and after coral death (sections covered in brown algae) due to aerial exposure during the 2015 El Niño low sea levels. > High res figure
|
PALAU TEMPERATURE AND REEFS: WHAT HAVE WE LEARNED?
The temperature-monitoring network provides data throughout the geographic, habitat, and depth ranges of the reefs of Palau (Figure 1) over a timescale that allows some consideration of trends (Figure 3). Combined with other types of information (currents, wind shifts, other weather conditions, storm disturbance), the detailed breakdown of temperature is important when evaluating the actual thermal environments where reefs exist, and provides a needed counterbalance to and accuracy check on SSST observations. What we have learned from network data includes the following:
1. Annual patterns of temperature at different depths and locations are variable, but indicate a possible increase in temperature.
The 18-year record of weekly mean temperatures on the outer slope shows the occurrence of a thermally dynamic environment (Figure 3a). Although the time frame is relatively short for climate change determinations, simple regressions (dashed lines in Figure 3a) indicate decadal upward trends of 0.29°C at 15 m, 0.49°C at 57 m, and 0.42°C at 90 m.
Annual patterns of temperature on shallow (10–15 m depth) outer reefs are now well documented (Figure 5). Lagoon areas exhibit similar patterns, but are warmer by about 0.5°C. Climbing from the winter low, the highest annual temperatures occur around early June. Shortly after that peak, temperatures decrease by 0.5°–1.0°C over the next two months. The drops usually occur in concert with strong west to southwest monsoon winds that often persist for many days. During autumn, temperatures again climb slowly to a second lower peak in mid-November, then start falling toward the next annual low in February. The relative forces driving the observed patterns, particularly the summer decrease, remain to be fully determined. Also, this shallow-water pattern does not extend onto reefs at or deeper than 35 m.
The summer decrease in temperature, while usually associated with monsoon storms, does not always occur. In June 2010 as temperatures reached the level where coral bleaching had previously been observed to start (30°C), the west and southwest monsoon winds failed to occur. Shallow temperatures continued to climb when they normally would have dropped (Figure 5), and bleaching occurred. From 1999 to 2017, 2010 was the only year in which this anomalous pattern occurred, but it may be typical of what occurs during bleaching years.
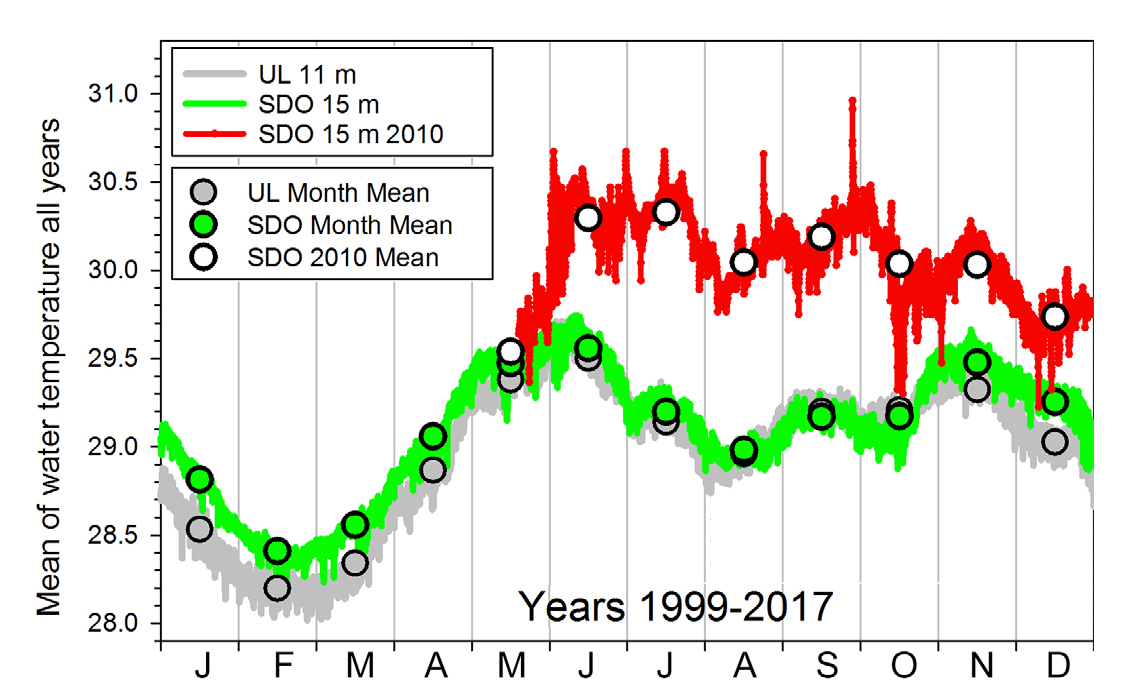
Figure 5. Annual pattern of water temperature at Ulong Rock (ULR) and Short Drop Off (SDO) for the period 1999–2017 from temperatures measured at 30-minute intervals averaged for all years, except 2010. Monthly mean values are shown as circles. The red curve shows all 30-minute 2010 data, including June–October bleaching, from May 20 to the end of the year, with monthly means indicated by circles. > High res figure
|
2. There is no deep reef refuge from bleaching conditions.
It has been suggested that deeper (“mesophotic”) reefs may serve as refugia from conditions that negatively impact shallow reefs (Baker et al., 2016), allowing survival of reef organisms/communities eliminated by unfavorable conditions in shallow areas. However, the experience in Palau has been that bleaching also impacts deep reefs, and this observation, as well as other factors (Colin and Lindfield, in press), question their potential as climate change refugia. The occurrence of rapid shifts in outer slope temperatures due to internal waves/tides, first described for Palau by Wolanski et al. (2004), has proven to be the dominant condition on reef faces from 35 m to 90 m. Their interactions with steep slopes imply that water is regularly upwelled during El Niño periods when thermoclines are shallow (Figure 4b) and there are phytoplankton blooms in the mesophotic reef zone (Figure 3c). During La Niña induced coral bleaching, internal waves may still occur, but much deeper (below 100 m depth), so they are not detected by thermograph arrays in shallower reef waters.
There is no question now that temperatures associated with bleaching (near 30°C) can occur in Palau to depths at the lower limits of coral growth. The often unithermal profile from surface to 90 m depth during the bleaching event of 2010 (Figure 3d,e) indicates that the normal stratification in the water column disappears. While there may be mechanisms operating during El Niño and ENSO neutral periods that potentially provide cooling to reef waters through upwelling, these break down during La Niña, preventing any cooling potential to reefs from deeper waters.
3. The comparison of SSST with in situ records over years indicates a need to recalibrate their relationships.
Long-term in situ temperature monitoring provides the data sets necessary to fully evaluate the accuracy of SSST and its relationship to deeper reef environments. If the assumption is made that in situ data are accurate within the limits of their precision and their calibration, this allows the critical comparison with remote-sensing-derived values. A preliminary analysis indicates that the accuracy of SSST compared to in situ values decreases with increasing depth (Figure 6). Comparing daily mean temperatures for three years with different ENSO conditions (2010 – La Niña, 2015 – El Niño, 2013 – neutral) provides an informative perspective. During 2010 (a bleaching year), daily means to 35 m were highly correlated with SSST (Figure 6), understandable since the water column was nearly unithermal much of the time. However, 2015 with its El Niño and cool water relatively shallow, did not have a close correlation, reflecting the cooler temperatures found at 15 m and 35 m depth. The ENSO neutral year (2013) was intermediate, but still demonstrated a decreasing correlation between in situ and daily SSST with depth. Although there can be a significant correlation between daily SSST and daily mean in situ measurements, it should also be remembered that there are often errors of some magnitude on any single day between SSST and in situ values. Efforts are needed to understand why these differences occur and what steps can be taken to modify SSST processing to reduce errors and thus increase the accuracy of heat estimates used in predicting bleaching conditions.
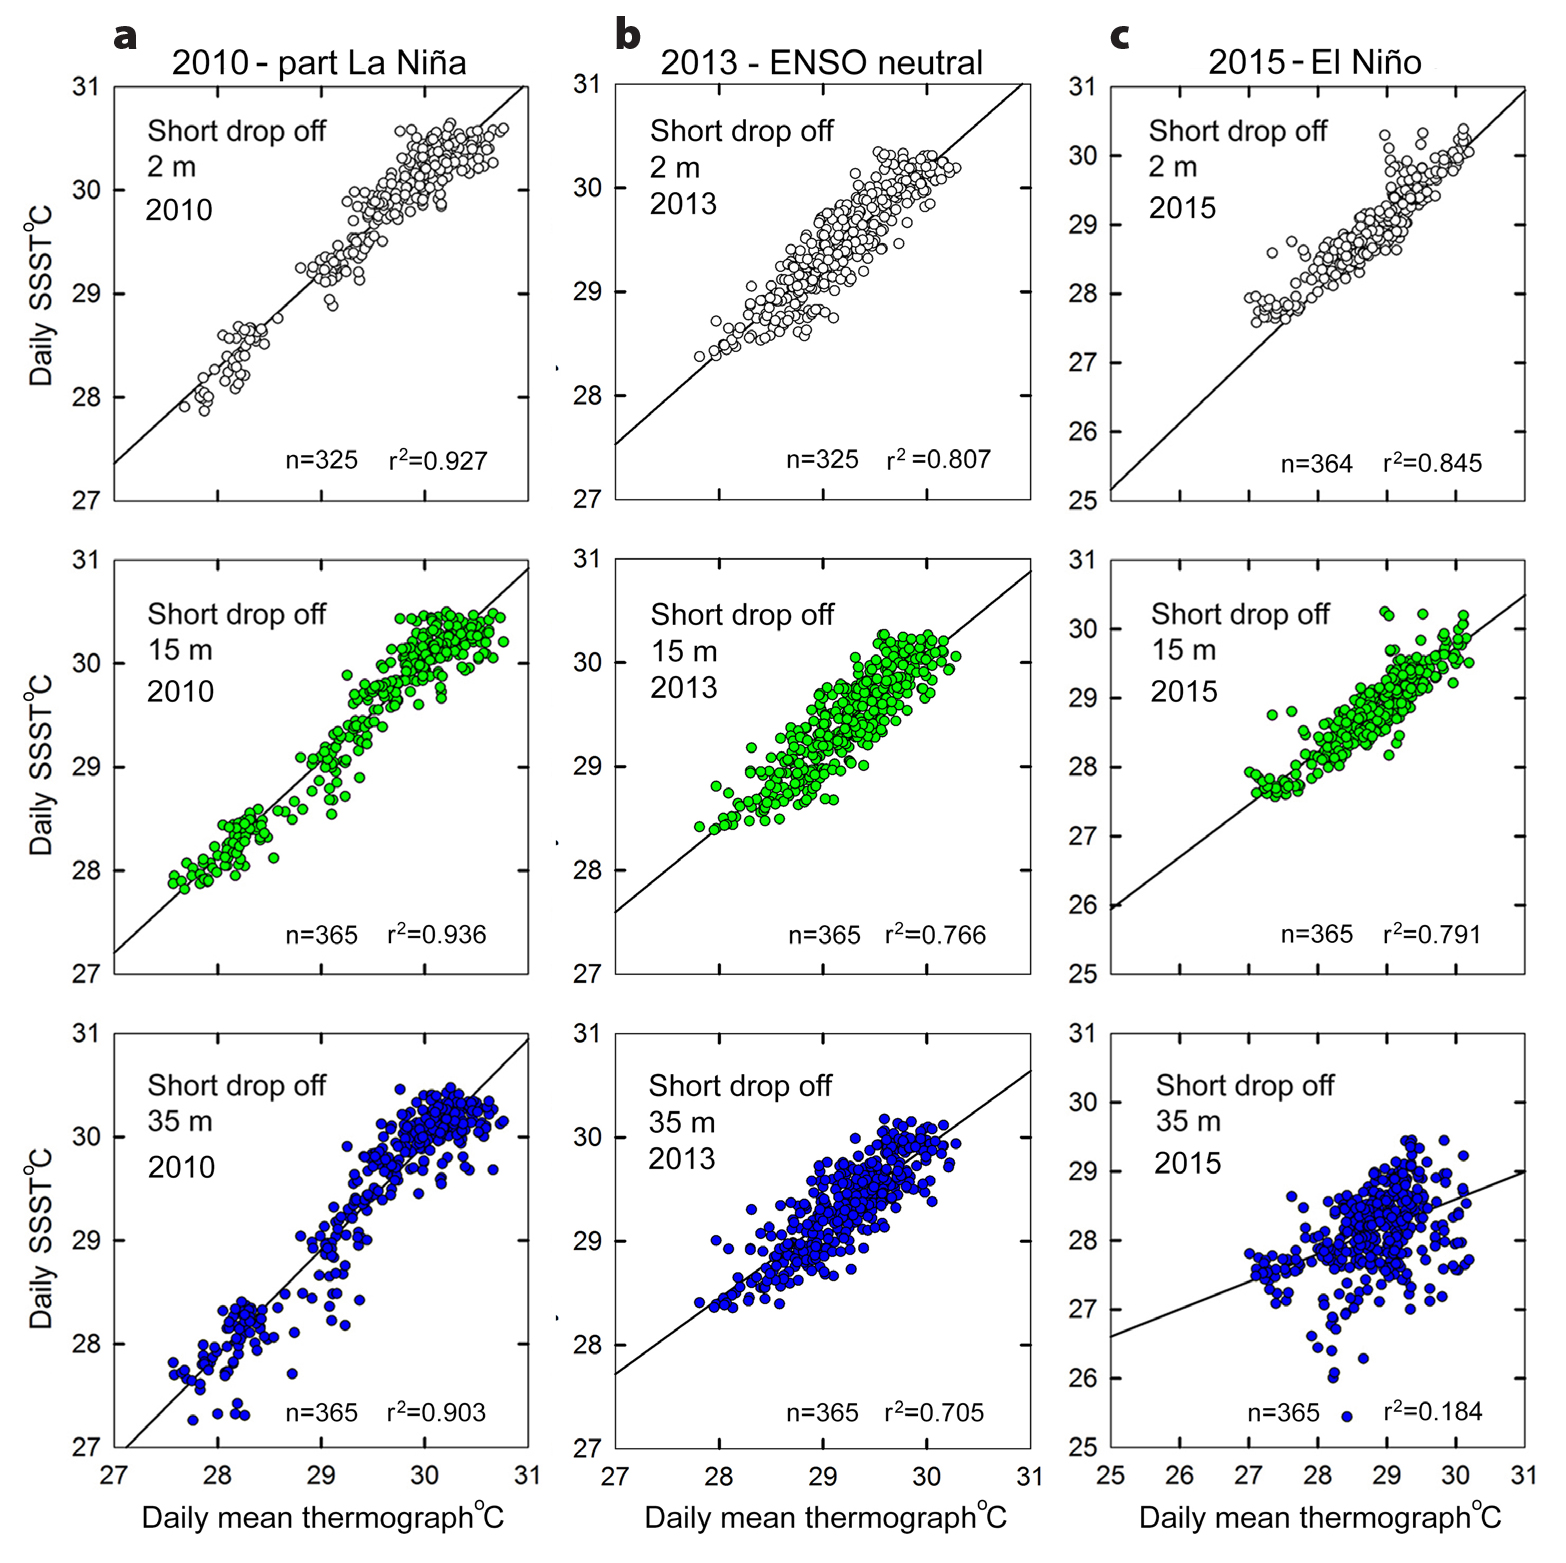
Figure 6. Comparisons of daily satellite sea surface temperature (SSST) from NOAA Coral Reef Watch and daily mean values from 30-minute thermograph temperature data from Short Drop Off at 2 m, 15 m, and 35 m depths. Values for r2 are shown in lower right corners. (a) Values from the 2010 partial La Niña coral bleaching year, with close relationships between SSST and thermograph data at all depths. (b) Values from the 2013 ENSO neutral year with relationships between SSST and thermograph data decreasing with depth. (c) Values from the 2015 El Niño year with relationships between SSST and thermograph data decreasing with depth, particularly compared to 2013. > High res figure
|
4. Monthly mean temperatures and sea level are closely correlated for deeper reefs.
Monthly mean sea level (MMSL) has a close relationship with monthly mean water temperature at 90 m depth (Figure 7), with decreasing correlation as depth decreases. It provides a way to look into the heat content found on deeper reefs by measuring sea surface height (SSH) through remote-sensing or tide gauge data. Use of MMSL has been proposed (Travis Schramek, Scripps Institution of Oceanography, pers. comm., 2018) as an additional metric (in combination with SSST) for developing predictions of coral bleaching conditions on reefs where there is no temperature monitoring at depth.
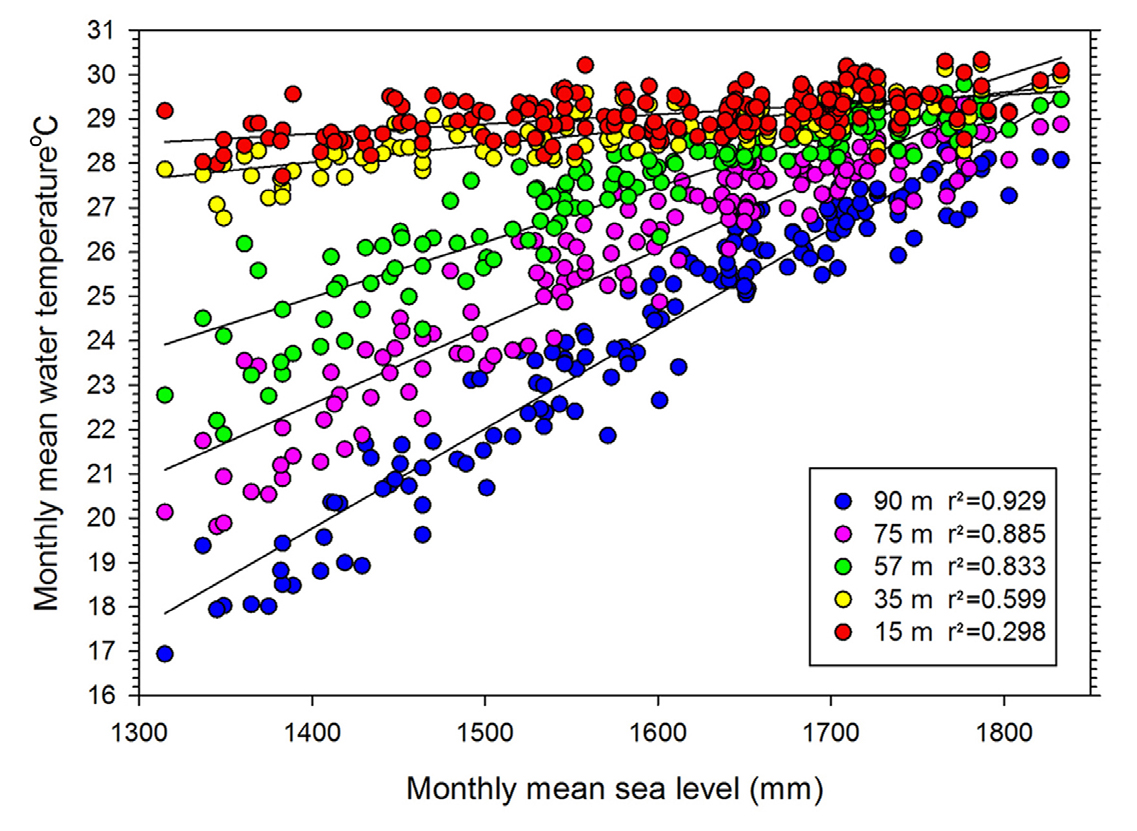
Figure 7. Comparison over 15 years of monthly mean sea level with monthly mean water temperature at five depths in Palau, from Short Drop Off 2000–2014. > High res figure
|
5. Temperature monitoring networks are important tools for examining both reef environments and their surrounding ocean waters.
The present network shows the value in having many permanent thermograph stations at different depths and habitats to thoroughly document conditions within an island/reef system. With changing climate, the need for longer and more comprehensive temperature monitoring stations directly on reefs is critical. Gathering extensive data, which might seem excessive and unneeded at present, ensures that when and if such data are needed to help explain unanticipated events, the data will be there. Compared to the costs of doing many types of oceanographic monitoring, those related to starting and maintaining a water temperature monitoring network are relatively low.
Vertical arrays of thermographs can be installed on outer reef areas with steep slopes at specific depths, ideally in holders attached permanently to the reefs, with each station marked by subsurface floats for easy relocation. Instruments can be exchanged at intervals of months to years. If properly set up, it only requires a few seconds for a diver to exchange instruments at a given depth. The quick-exchange capability allows installation at deeper depths, including those accessible by mixed gas rebreather diving, for improved collection of data on internal waves and ENSO thermal shifts.
FUTURE DIRECTIONS AND EFFORTS
1. There is a need for enhanced understanding of the relationship between remote-sensing and in situ temperature data.
Since the 1980s, perhaps no group of environmental researchers has more thoroughly embraced the globality of SSST measurements than coral reef scientists (Mumby et al., 2004), with numerous bleaching studies relying almost exclusively on SSST data (e.g., Peñaflor et al., 2009; Guest et al., 2012; Ainsworth et al., 2016). Despite this acceptance, there are some important caveats with regard to using SSST values.
Data from established in situ reef stations using accurate calibrated instruments are the gold standard temperature records for coral reefs, and increased in situ monitoring on coral reefs at all depths is needed. Other types of new oceanographic technology, such as profiling gliders, can provide additional important thermal data not available from instrument arrays. Sea level data from tide gauges and satellite-derived SSH information holds promise for improving understanding of remotely monitored coral bleaching conditions and should be incorporated into the systems in place for assessing bleaching risk. The relationships between remote-sensing and in situ instrument temperature data need to be reexamined, with the goal of increasing accuracy of remote data to reflect thermal conditions throughout the water column where reefs exist. To truly understand the implications of a warming ocean on coral reefs and other tropical marine habitats requires more attention to gathering baseline information and understanding present-day thermal dynamics. Given global trajectories, the preliminary indication of increasing temperatures on shallow and deep reefs in Palau is not surprising, yet the large and unpredictable variations there produce uncertainty about the reliability of trends.
2. The thermal conditions on shallow-flat reefs need more attention.
Shallow reef areas generally have elevated temperature regimes and need increased attention to determine whether they have the potential to be the drivers of evolution and/or adaptation toward increased temperature tolerance through a combination of symbiont-host factors. Shallow reefs are very important locations where “greater high-frequency temperature variability may represent particularly important opportunities to conserve coral ecosystems against the major threat posed by warming ocean temperatures” (Safaie et al., 2018). Studies looking at areas with highly elevated temperatures in isolated pools along island shores, a relatively rare habitat, have found evidence for adaptation on several levels (Thomas et al., 2018). Shallow reef areas are a much more widespread habitat, found along the thousands of kilometers of barrier reefs of Indo-West Pacific reefs, and need more attention in this regard, as they are a nearby potential source for new propagules if deeper outer slope coral communities are devastated by bleaching.
3. The importance and effects of upwelling on coral reef futures need attention.
It has been suggested that the upwelling of cool water from deeper environments may produce areas where coral bleaching is less likely in a given reef area (Skirving et al., 2010; Guest et al., 2012). Identifying such areas as “resistant” to bleaching conditions, potentially to be preserved as marine protected areas, is appealing, but relies on the upwelling of cool water during bleaching events. Our data show this is unlikely in Palau. Prior to the 2010 bleaching event, the occurrence of ~30°C water at 60–90 m depth had never been quantified on Indo-Pacific reefs, and now there is a need to examine other locations for similar attributes.
In addition to long-term vertical arrays and extensive lagoon deployments, we now have a network of 28 thermograph stations (Figure 1b) covering the entire outer slope of the main island group and sampling once per minute at 57 m depth. That depth was chosen because initial studies indicated 57 m was the depth of near maximal thermal dynamics and was a feasible depth for diving deployments. The network was installed in 2014 and is now generating around 15 million data points per year, providing the data to answer questions concerning the existence of island-trapped internal waves, the effects of storm passage, and the relationship between ENSO and thermal activity. We have also extended the 57 m network to all six of the southwest islands of Palau, with one array at each island group, giving the network a latitudinal expanse of over 500 km and crossing the main flow of the North Equatorial Countercurrent.
4. New approaches to measuring thermal stress are needed.
In Palau, the relationship between SSST and temperature regimes on deeper areas breaks down starting at 10–15 m depth (Figure 6). MMSL from tide gauges or SSH from satellite measurements may provide needed insight into reef temperatures below the surface. Data from Palau support using SSH, along with SSST, to remotely measure thermal conditions associated with coral bleaching (Travis Schramek, Scripps Institution of Oceanography, pers. comm., 2018).
The realization that temperatures inducing bleaching extend into deep water during La Niña events is important; in many locations, deeper reefs may have already been severely degraded by undetected bleaching. Unquestioned use by some of SSST data for most considerations of thermal regimes on reefs needs to be reexamined. There is also a risk in assuming that relatively short data collection periods provide information that is representative of temporal dynamics. Experience in Palau indicates periods of a year or less provide little understanding of the longer-term conditions found on reefs. This is particularly true for deeper reef areas.