
Full Text
PURPOSE OF DEVICE
Changes in dissolved oxygen concentration can cause dramatic shifts in chemical, biological, and ecological processes in aquatic systems. In shallow coastal areas, this can happen on short timescales, with oxygen increasing during the day due to photosynthesis and declining at night due to respiration. We present a system controlled by an Arduino microprocessor that leverages the oxygen-consuming capacity of sediments to manipulate dissolved oxygen in an aquarium tank to planned concentrations. With minor adjustments to the Arduino code, the system can produce a variety of dissolved oxygen patterns, including a diel cycle. Designed to be user-friendly and scalable if needed, the system uses easily acquired, low-cost electronic and aquarium components. Its simplicity and accessibility permit deeper exploration of the effects of dissolved oxygen variability in aquatic systems, and the use of Arduino code and basic electronics makes it a potential tool for teaching experimental design and instrument fabrication.
BACKGROUND
The availability of dissolved oxygen (DO) is a major factor governing aquatic ecosystem function and is an indicator of water quality and ecosystem health (Diaz and Rosenberg, 1995, 2011; Wenner et al., 2004; Middelburg and Levin, 2009). The DO concentration in aquatic environments is controlled by the balance of oxygen sources (mixing with the atmosphere, advection of oxygenated water, photosynthetic production) and sinks (aerobic respiration and abiotic oxidation), and shifts in this balance result in cascading chemical, biological, and ecological effects (Middelburg and Levin, 2009). Changes in DO concentration occur across temporal and spatial scales, from widespread, seasons-long bottom hypoxia on continental margins to dramatic daily or sometimes hourly oxygen fluctuations in shallow, semi-enclosed coastal lagoons or embayments. Most low oxygen events are this second type, relatively short in duration but occurring frequently (Wenner et al., 2004). Many researchers have examined the effects of declining or persistent low DO on water and sediment chemistry (McCarthy et al., 2008; Lehrter et al., 2012; Neubacher et al., 2013; Foster and Fulweiler, 2019) and organismal behavior and physiology (Diaz and Rosenberg, 1995; Long et al., 2008; Levin et al., 2009; Sturdivant et al., 2012; Riedel et al., 2014; Calder-Potts et al., 2015). However, it is far less common to see investigations into dynamic variation in DO, likely because of the difficulties in precisely and repeatedly manipulating DO in the lab.
DO can easily be increased in water by bubbling with air, but decreasing DO requires either chemical consumption or physical expulsion of oxygen from solution. An often-used method of decreasing DO involves stripping it from the water by bubbling with N2 gas. Studies of low oxygen effects that run for multiple weeks or months, however, may require large amounts of N2 gas, which can be expensive, prompting investigations into ways to reduce the amount of gas needed (Bevan and Kramer, 1988; Peterson and Ardahl, 1992; Grecay and Stierhoff, 2002). Oxygen can also be removed by “vacuum degassing,” applying a partial vacuum to the water to remove DO from solution. This requires an airtight vacuum setup that may not be feasible for some researchers (Mount, 1961; Miller et al., 1994). More recently, researchers have developed methods that rely on chemical consumption rather than physical removal of DO to produce low oxygen water. Thetmeyer et al. (1999) leveraged the respiration of the fish study subject itself to draw down DO, controlling hypoxic, normoxic, and oscillating oxygen treatments with an automated system (Thetmeyer et al., 1999). For this method to work, the fish must consume enough oxygen to change the DO of the experimental environment, which may not be possible for smaller study subjects or those for which wall effects are a concern. Long et al. (2008) presented an alternative method using sediments to decrease DO by percolating water through a “fluidized mud reactor” that consumed oxygen (Long et al., 2008). The resulting anoxic water was then mixed in different proportions with fully oxygenated water to produce predetermined DO concentrations. This setup is convenient for creating water with stable DO concentrations, but it does not easily allow for complex manipulations of DO change through time.
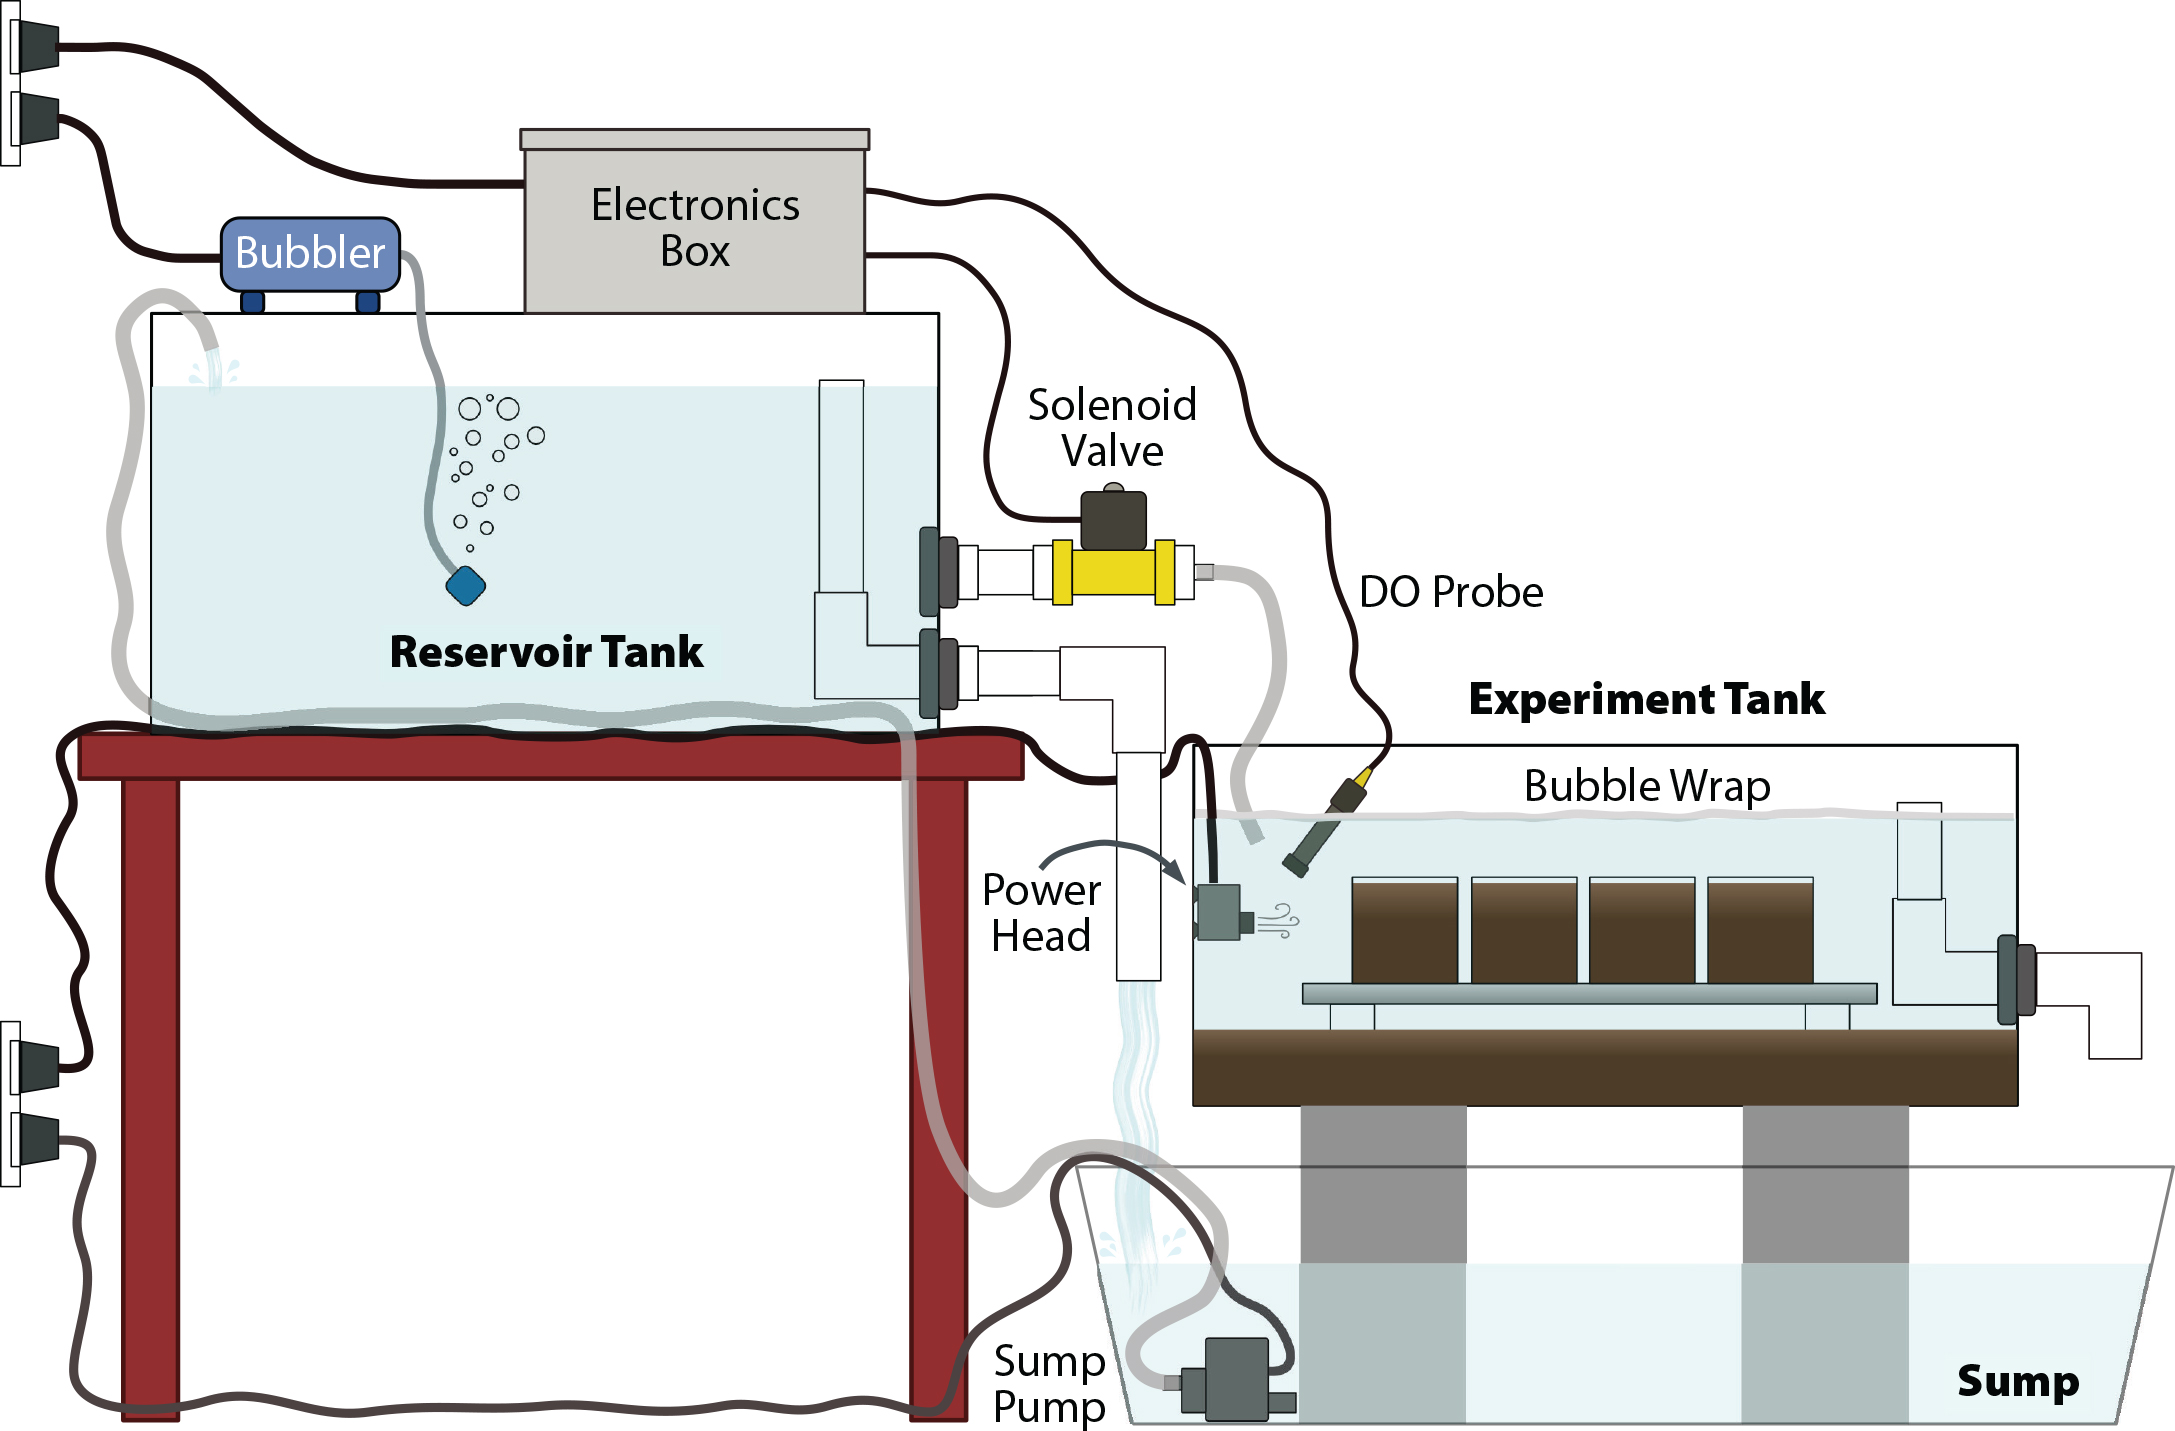
The existing DO manipulation methods pose a barrier to entry for many researchers because of their costs and complexities. Additionally, many methods have been designed to simulate long-term hypoxia, whereas in coastal systems, DO concentrations can vary on short timescales. Here, we describe and test a DO manipulation system that can be constructed in a laboratory or classroom setting using easily acquired electronic and aquarium components. The closed-loop system does not require N2 gas purging or vacuum degassing; instead, it relies on sediment oxygen demand (SOD) to draw DO down, and it increases DO by periodically opening a solenoid valve to allow oxygenated water to flow in from an upstream reservoir tank (Figure 1). The provided code is uploaded to an Arduino microprocessor that monitors and adjusts the DO in the experiment tank to a pattern planned by the user, simultaneously recording and displaying the DO data. This system was built to study behavior of and SOD by infaunal organisms held individually in small sediment-filled aquaria (Figure 1), but it could be used for a variety of shallow-water systems and study organisms. This simple, low-cost, open-source method of manipulating DO in the lab will allow for more varied studies into how change in DO affects aquatic systems.
|
|
MATERIALS AND COSTS
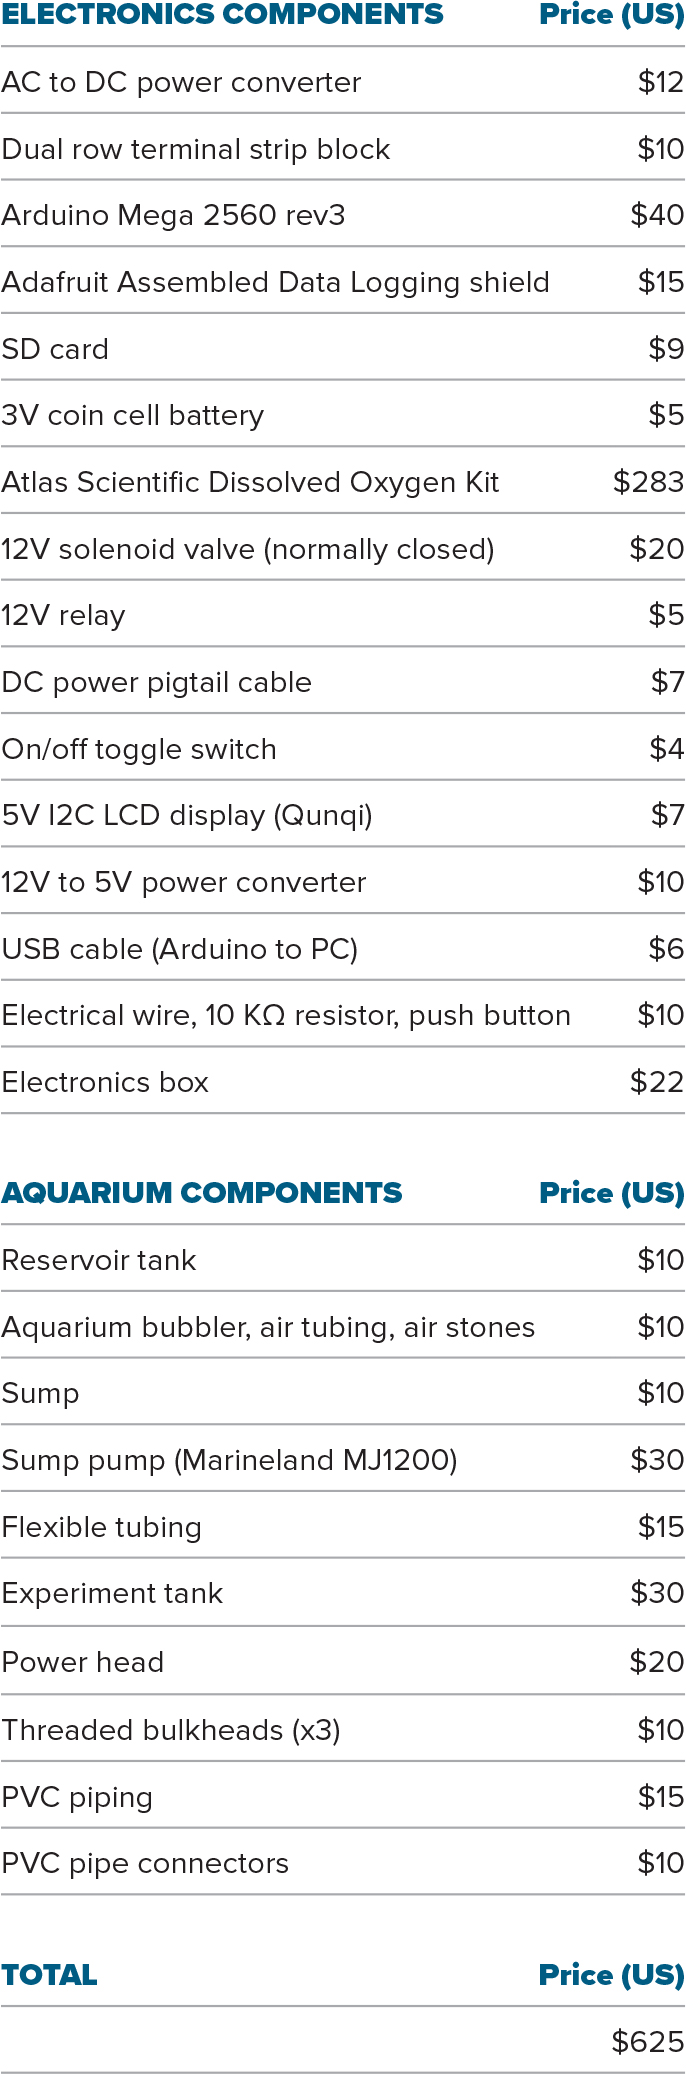
Table 1 outlines the system components. We estimate the total cost of constructing this system to be approximately US$625 in 2021, not including shipping expenses. Note that the components list consists only of consumable items (e.g., wire, tubing, plumbing) and specialized equipment (e.g., Arduino, Atlas Scientific EZO DO kit, pumps, solenoid valve). Non-consumables and tools needed for assembly are not included because it is assumed that the user will already have access to many of these items. Cost of construction might also be substantially lowered if materials can be purchased individually rather than in large packs, or scavenged from other projects, as only a single item or a very small amount is required for most components. An undergraduate or a particularly capable high school student should be able to construct and begin using the system within a couple of weeks.
Table 1. Components list for laboratory dissolved oxygen experiments. > High res table
|
ASSEMBLY STEPS
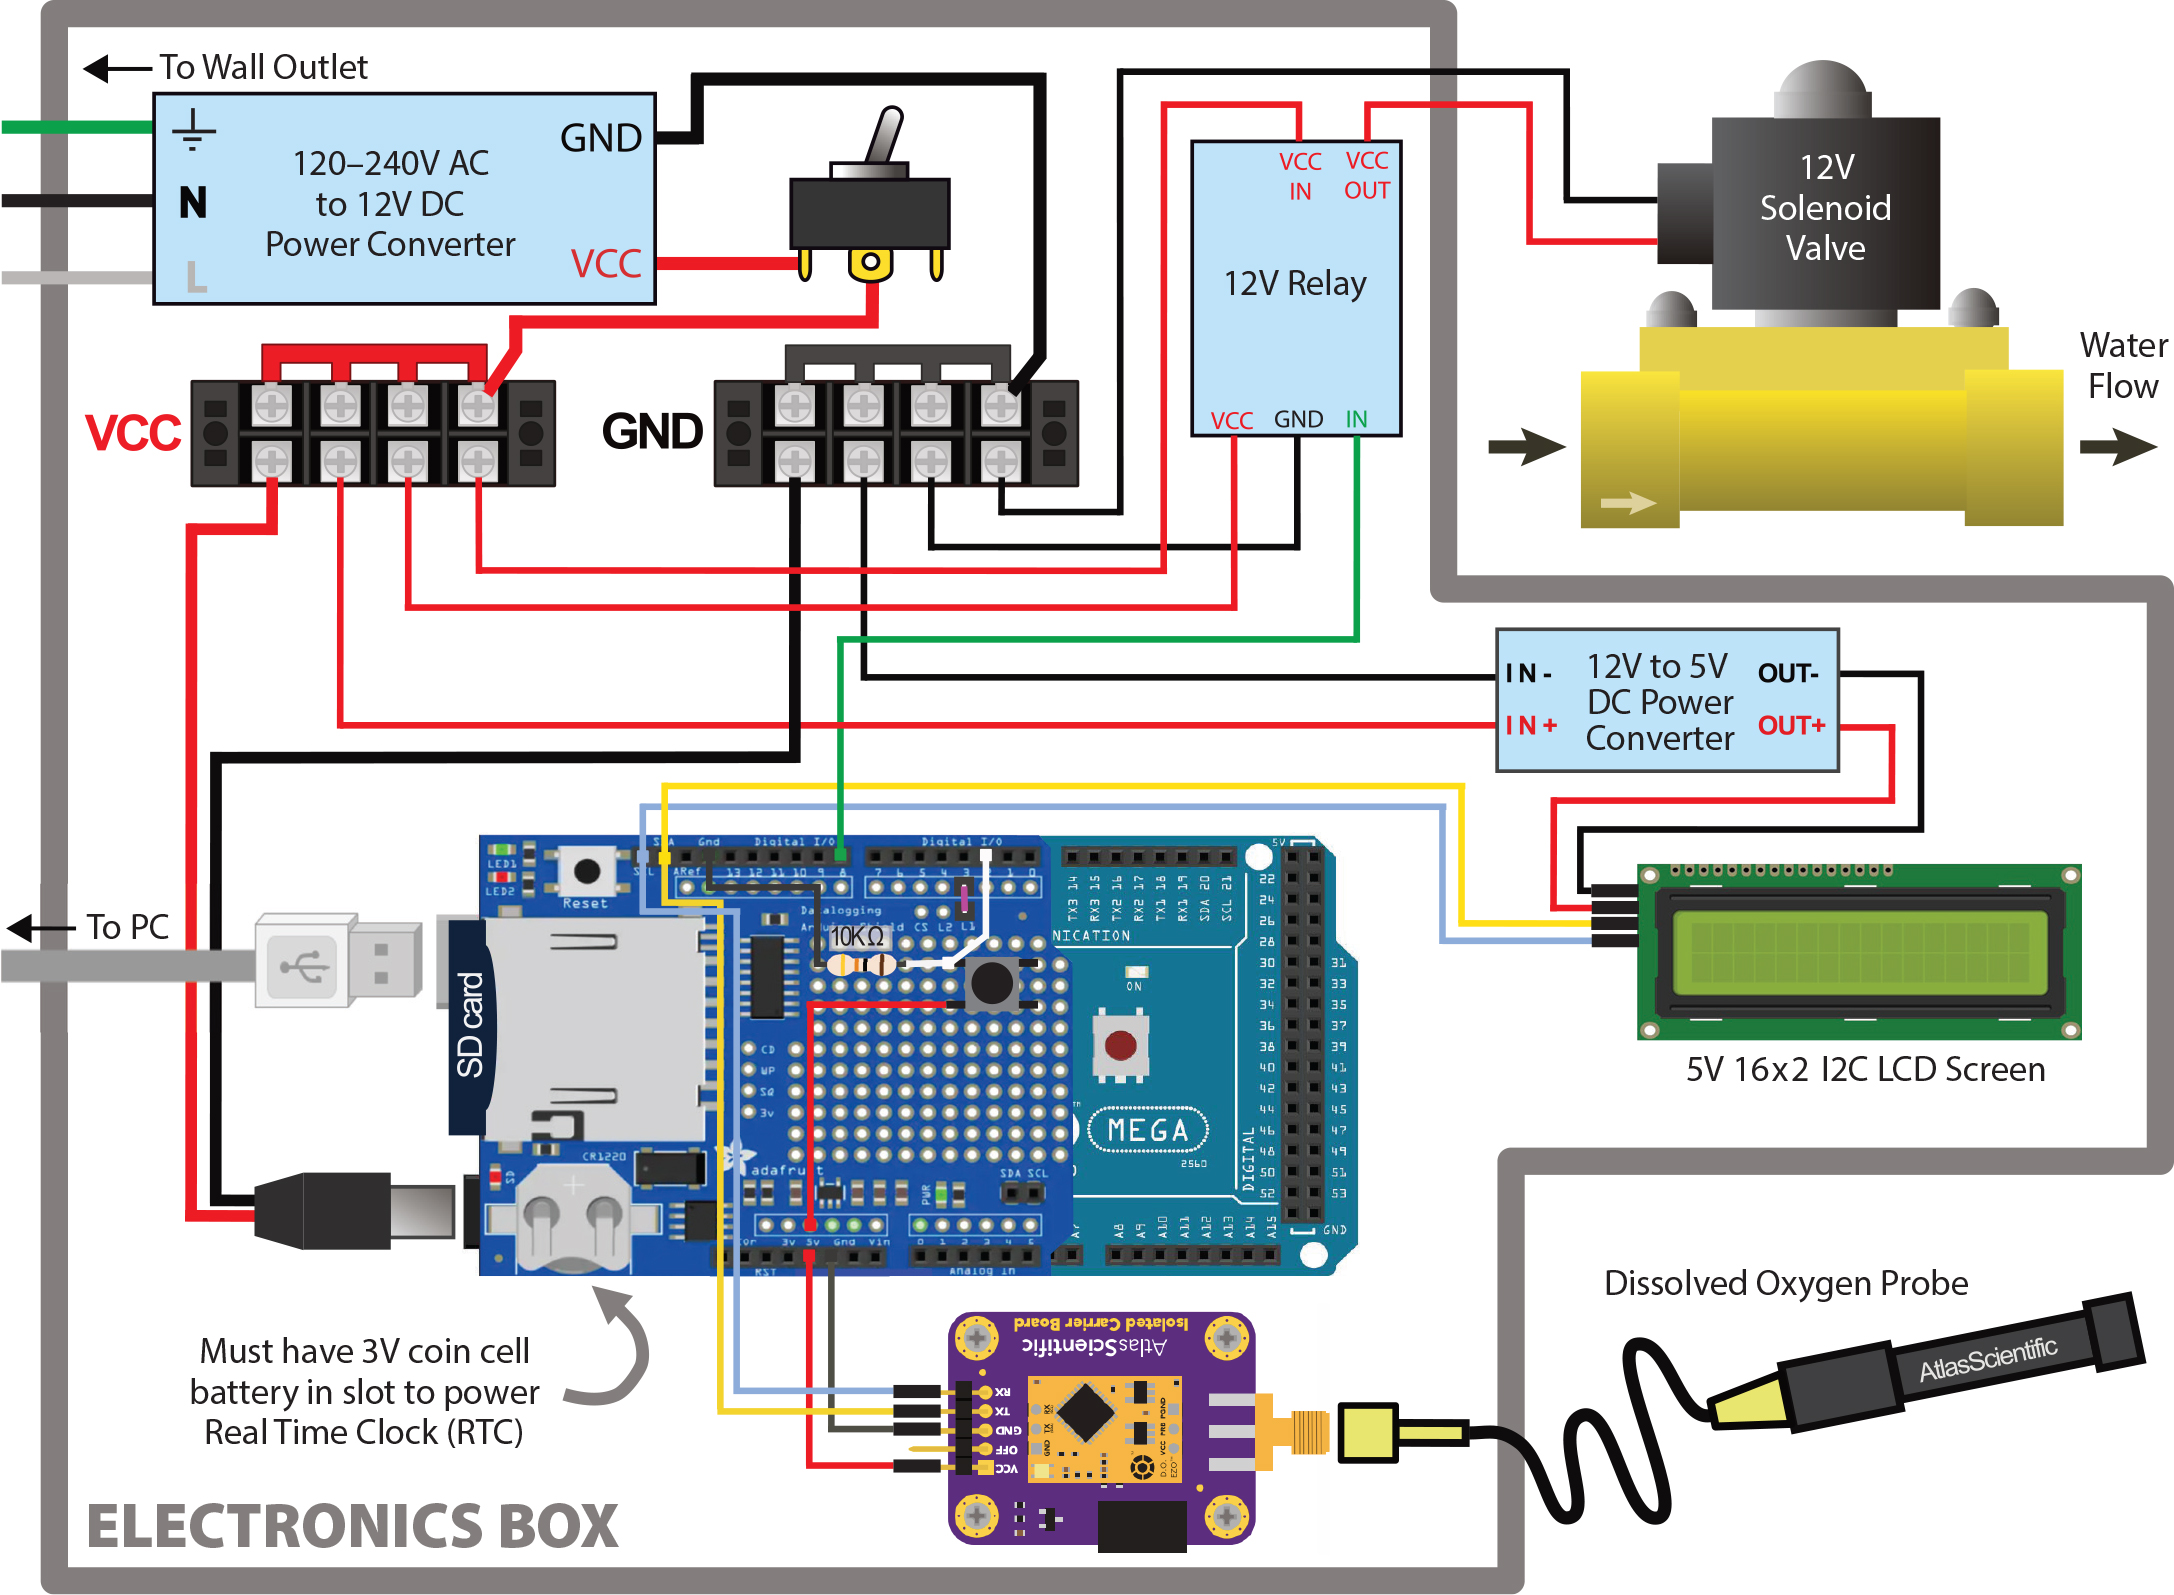
First, assemble the electronics according to the wiring diagram in Figure 2. The Arduino Mega®️, solenoid, and relay may all be powered by the same 12V power source. The Adafruit® data logging shield is mounted directly to the Arduino via soldered header pins. The Atlas Scientific®️ EZO DO circuit is mounted on an electrically isolated EZO carrier board and connects to the SCL (clocking) and SDA (data-transmitting) pins on the data logging shield to communicate with the Arduino (Figure 2). Communication between the Arduino and the EZO DO circuit is in I2C protocol to allow for easy addition of secondary devices, in case more circuits and sensors are desired to scale up the system. The EZO DO circuit must be converted to I2C protocol and the I2C address changed to correspond to the address defined in the oxygen manipulation code to communicate with the Arduino. The EZO DO circuit should also be adjusted with temperature and salinity offsets and two-point oxygen calibrated before each use. Directions on conversion to I2C protocol, offset adjustments, and calibration are in the EZO DO circuit documentation. An LCD screen is included to display the average measured DO over the previous several measurements and the planned DO, allowing the user to easily assess whether the system is functioning properly and following the prescribed pattern. Power to the LCD can be converted from 12V to 5V DC with a power converter, as shown in Figure 2, or sourced from the 5V pin on the Arduino. A master on/off power switch is also included and a small push button is wired in to control when the oxygen manipulation code begins (“start” button).
|
|
When the code is started, it executes in repeated “loops”; within a single loop, the system measures the DO in the tank, calculates the average DO over the last five readings, compares the average DO to the programmed DO, opens the valve to allow in oxygenated water if necessary, logs the data to the SD card, and displays the average and planned DO on the LCD screen. The code may be restarted by pressing the “reset” button on the SD shield and then the wired-in “start” button. The average DO value is used rather than the instantaneous DO value to adjust for inherent noise in measurements (i.e., to prevent the system from allowing a single anomalously low measurement to trigger oxygenated water to flow in, even when the average DO is above the planned level).
Once the electronics have been assembled, construct the closed loop tank system (Figure 1). Three tanks are used: the upstream reservoir tank for oxygenated water, the experiment tank in which study subjects are held and DO is manipulated, and a sump. Oxygenated water will constantly circulate between the reservoir and the sump, and it will be intermittently diverted into the experiment tank whenever DO needs to be increased.
The reservoir tank and the sump may be made from simple plastic bins. Ideally, the experiment tank should be a clear aquarium tank so study subjects may be easily observed. Fit the experiment tank with an outflow standpipe and fill the tank with a layer of organic-rich sediment, which will consume oxygen and drive down DO in the overlying water. Fill the remaining space in the tank up to the top of the standpipe with seawater and allow suspended sediment to settle. Then, make two outflow holes in the reservoir tank. Attach a standpipe to the first hole and add plumbing to the outlet to direct overflow water into the sump. Attach the solenoid valve to the second hole and add piping or tubing to direct flow from the solenoid into the experiment tank. Position the reservoir tank higher than the experiment tank and fill the reservoir tank with seawater up to the standpipe. Place a sump pump in the sump and route tubing from its outflow up to the reservoir tank to close the loop.
Suspend the Atlas Scientific DO sensor in the experiment tank. The water’s surface should be covered by a sheet of bubble wrap (which is oxygen-impermeable and will float at the surface) to prevent diffusion of atmospheric oxygen into the water. A small aquarium power head should be mounted in the experiment tank to gently circulate the water and prevent stagnation. In our setup with a 20 gallon experiment tank, a 120 gph power head was sufficient. Manipulations by the Arduino are based on the readings from the sensor, so it is critical that the water be mixed such that the sensor readings represent the DO of the bulk water in the tank as accurately as possible. It is also important to note that if the system is to be used for rigorous experimental work, having all replicates in one tank presents the issue of pseudoreplication. To resolve this issue, multiple replicate experiment tanks should be plumbed and manipulated “in parallel,” or if it is only feasible to have one experiment tank, multiple replicate trials should be performed over time.
CODE
The annotated oxygen manipulation code and the calibration code are freely accessible for download on the code sharing platform GitHub (https://github.com/kgadeken/OxygenManipulationCode_GadekenDorgan2021). It is highly recommended that new users read the code and annotations thoroughly before setting up and using the system.
ASSESSMENT
To serve as a usable method for manipulating oxygen in the lab, the system must reliably, precisely, and accurately produce the programmed DO patterns in the experiment tank. We tested the system by programming it to generate a diel oxygen cycle, with DO concentrations ranging from 3 mg L–1 to 7 mg L–1. The diel cycle spans a wide range of DO values and demands the system adapt quickly to continually varying rates of DO change, making it a highly rigorous test of the system’s flexibility. Precision was gauged by the difference of each DO measurement from the programmed DO value at that time. To gauge the system’s accuracy, we took corroborating oxygen measurements with an Onset HOBO DO logger. The Atlas Scientific probe and HOBO logger were both two-point calibrated immediately before starting the trial. The Atlas Scientific probe and the HOBO logger were secured in the experiment tank as close together as possible in the upper-middle of the water column at the same vertical height from the sediment surface. The HOBO logger was set to measure DO every five minutes.
Figure 3 shows the results of the diel cycle trial. The system closely followed the diel pattern during rising and high DO periods but deviated slightly during falling DO. This indicates that the sediment was not consuming enough oxygen at these times to keep up with the programmed rate of decrease. At its greatest point, the difference between the measured DO and the planned DO was 0.91 mg L–1. However, over 99% of the measurements taken deviated from the planned value by less than half of that maximum difference (±0.46 mg L–1), and ~89% deviated by less than a quarter (±0.23 mg L–1), indicating that the system typically followed the programmed pattern very closely.
|
|
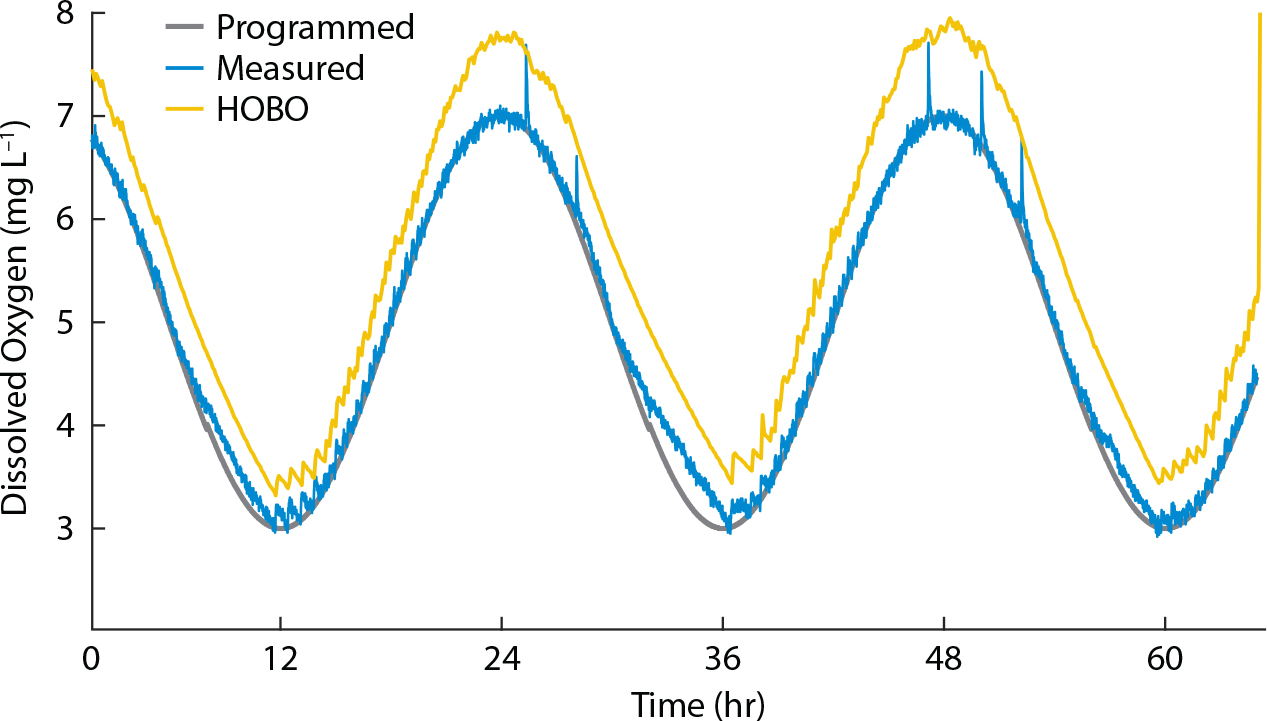
Because the HOBO was set to take measurements at 5 min intervals while the oxygen manipulation system measured DO every 37 s, values were interpolated from the HOBO sensor measurements to correspond to each of the measurements from the oxygen manipulation system. The HOBO measurements followed the same diel pattern as the system but were positively offset an average of 0.62 mg L–1. The data from the oxygen manipulation system and the HOBO were both detrended and then analyzed for correlation, and no lag was found between the two data sets. Given this result, it is likely that the difference between the sensor measurements is largely due to calibration error.
A potential issue with this setup lies in the use of sediment oxygen demand as a DO sink. Using SOD rather than N2 gas limits the rate of oxygen removal from the water, as shown in the diel cycle trial during the periods of DO decline (Figure 3). Vigorous purging with N2 gas or vacuum degassing can remove all oxygen from solution in seconds or minutes (Mount, 1961), whereas our system using SOD typically takes several hours to decrease from full oxygen saturation to hypoxia. Also, low DO is well known to be accompanied by a suite of related changes in sediment and water chemistry, including altered chemical concentrations, changes in nutrient flux, and modified pH (Froelich et al., 1979; Burnett, 1997; Middelburg and Levin, 2009). This is in contrast to the N2 gas and vacuum degassing methods that strip DO by physically removing it from the water, and thus do not result in the same chemical reactions as SOD. However, using sediments to scrub oxygen more closely resembles how low DO occurs in situ. Bubbling water with N2 gas to remove oxygen decreases the pCO2 of the water, and so increases pH, in contrast to oxygen consumption by sediments that typically decreases pH because organic matter remineralization generates CO2 (Gobler et al., 2014). Though oxygen cannot be drawn down as quickly and the effects of change in DO alone cannot be as cleanly isolated with the SOD method because other chemical characteristics are unavoidably covarying, it more accurately represents DO variability as it would be encountered in natural settings. Also, because this system is closed loop and relies on biological processes to function, issues with excessive buildup of ammonia and nitrates may arise if experiments are run for extended periods without replacing the water in the tanks. This system is best applied in situations that do not require independent control of water chemistry variables and for experiments that can be performed within a short time frame.
MODIFICATIONS AND FUTURE DEVELOPMENT
There are several ways that the user can modify the system to work more effectively or to troubleshoot issues. We divide them into “out-code” modifications, or changes to certain physical or structural features in the system, and “in-code” modifications, or changes to the Arduino code that alter the way the oxygen manipulation is executed.
Out-Code Modifications
The efficacy of the system depends heavily on the oxygen-consuming capacity of the sediments in the experiment tank. Use the most organic-rich sediments available and maximize the ratio of sediment surface area to bulk water volume by using as shallow a tank as possible. Before starting construction of the system, we recommend assessing the oxygen consumption rate the mud can achieve by putting mud into a tank with overlying water to the height anticipated for the experiment, adding a power head to circulate the water, covering the water with bubble wrap, and recording the oxygen through time. If the sediment is not consuming oxygen at a sufficient rate, adding labile organic matter or fertilizer to the sediment or displacing some of the overlying water with a solid object can help increase oxygen drawdown.
Although the power head in the experiment tank may be effective at laterally circulating water, there is still potential for vertical DO gradients to form in the tank, and the steepness of the gradient will increase closer to the sediment surface. Thus, the positioning of the probe in the tank is important. The probe should be secured in position well above the sediment surface and close to the vertical level where study organisms will likely be located. Because the code manipulates DO based on the readings from only one probe, it is also critical to take care in calibrating the sensor, as exemplified by the diel cycle trial (Figure 3). Before it is used, the sensor should be two-point calibrated and its accuracy corroborated at multiple DO concentrations with measurements from a reliable instrument. Though the calibration held well in the diel cycle trial, during longer experiments we advise periodically comparing the DO concentration against a reliable measurement to check for sensor drift.
Because this system was devised for a study designed to observe responses of sediment-dwelling organisms to changing DO, the study organisms were kept in smaller replicate containers filled with sediment within the experiment tank. We constructed a platform that sat on stilts just above the sediment layer to support the replicate containers (Figure 1). This platform had as many gaps as possible so that the water at the sediment surface was well mixed.
In-Code Modifications
Two main features of the code may easily be altered to change the way that DO control is performed: the amount of time the solenoid is held open, and the pause duration between loops.
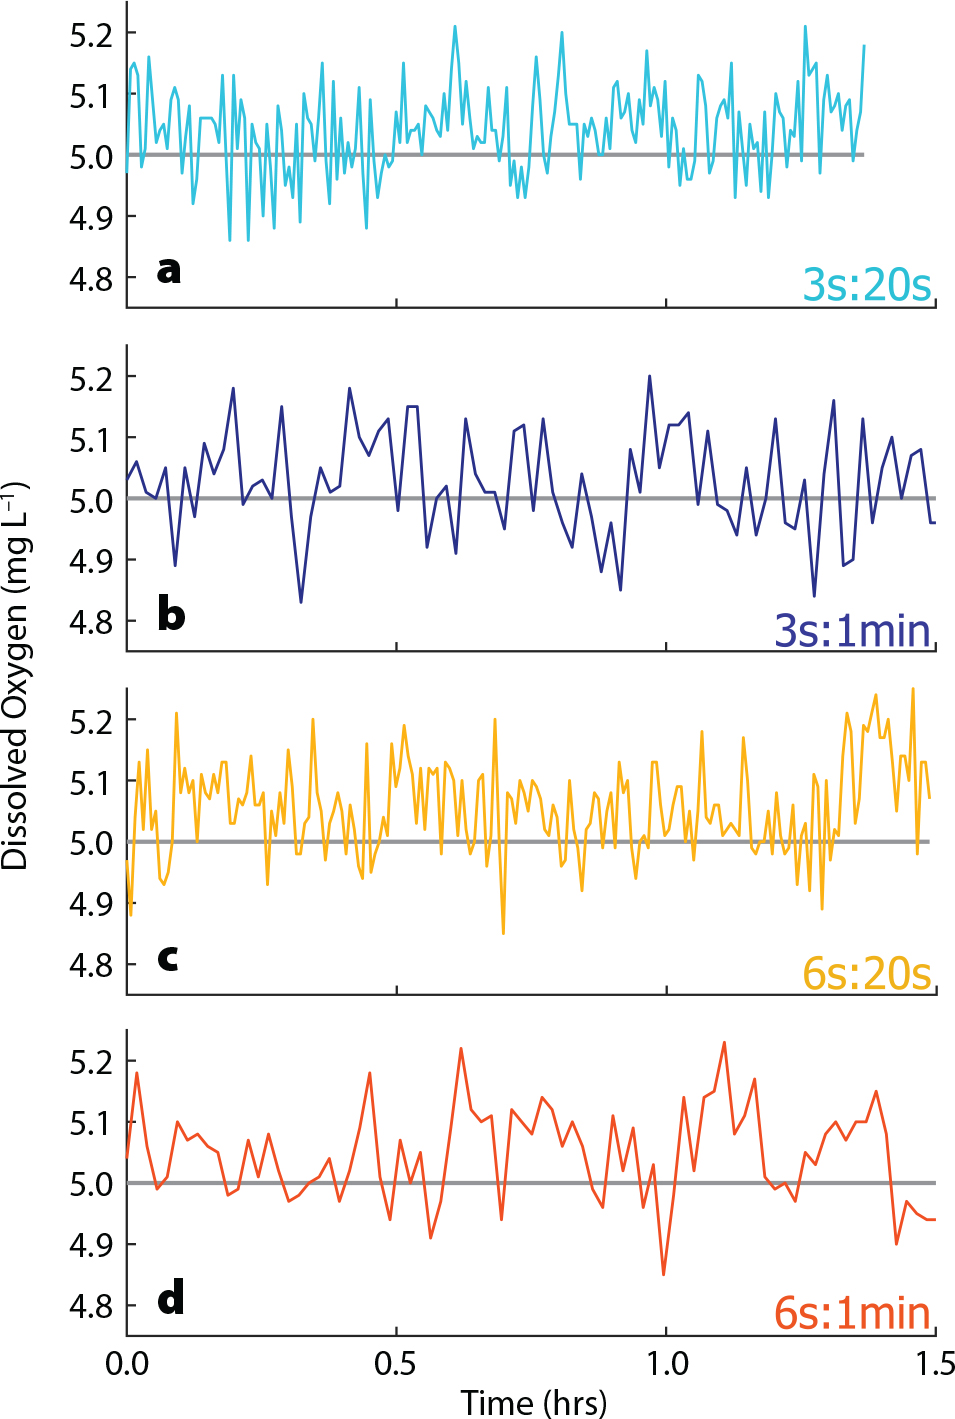
If DO data are noisy and repeatedly jump substantially above the planned DO concentration, too much oxygenated water may be flowing in with each loop, and the amount of time the solenoid is held open should be decreased. Decreasing the duration between each loop changes the frequency with which the DO is compared to the planned value and manipulated, essentially changing the sensitivity of the system. If this duration is too short, the power head in the tank may not have enough time to circulate the high oxygen water added in the previous loop, resulting in inaccurate measurements and manipulation. The time the solenoid is held open and the pause duration between loops work in concert to affect the precision of DO manipulation, and some amount of trial and error will be necessary to determine the optimal values for each. That said, the system has proven to be somewhat resilient to changes in these variables. We performed a sensitivity test by programming it to maintain DO at 5 mg L–1 for ~1.5 h four times, each with a different combination of the amount of time the valve is left open (either 3 s or 6 s) and the time between loops (either 20 s or 1 min) (Figure 4). In the four trials (3s:20s, 3s:1min, 6s:20s, and 6s:1min), the maximum deviation of the measured DO from the planned DO was 0.21, 0.27, 0.25, and 0.23 mg L–1, respectively. The percentage of time that the measured value deviated by less than half the maximum deviation was 80%, 91%, 82%, and 81%, respectively. All four trials effectively maintained the programmed DO concentration within a small range of variability.
|
|
System Flexibility and Future Development
Aquatic organisms, particularly in coastal areas, exist in an environment with complex variations in DO that have long been difficult to reproduce in a lab setting. Perhaps the most compelling prospect of the described system is its capacity to replicate this variation for study. The programmed oxygen pattern is controlled directly through the Arduino code to allow greater flexibility in the choice, combination, and order of programmed patterns. For example, simply by adjusting the value or equation that the Arduino code is programmed to match and re-uploading the code, the system could be made to alternate increasing and decreasing DO at specific rates, allowing more rigorous study of how the rate of increase or decrease in oxygen affects animal behavior. Or, as was shown in the system test, it can produce a pattern from a modified sine function that mimics a diel oxygen cycle, an extremely common oxygen pattern in shallow coastal waters that remains understudied. The system could further be retrofitted with a high-pressure valve and a small N2 tank for supplementing with N2 purging when a more rapid oxygen decrease is needed, or the oxygen probe could be upgraded to an optical sensor for more accurate and precise oxygen manipulation.
The system is also potentially useful for educational applications. It is designed to be as simple and modular as possible, with readily available and reasonably priced components and relatively easy construction. Furthermore, using the code requires some familiarity with the Arduino programming language and can serve as a model of how to use Arduino to build instrumentation for scientific inquiry. The system could be equally employed for classroom behavioral or physiological experiments and as a tool to teach experimental instrument fabrication.