
Full Text
Physical oceanographers measure the intensity or vigor (transport or velocity) of ocean circulation via current meters, geostrophic calculations, satellite-tracked drifters, and modeling of tracer distributions. These techniques are complementary, and none are now used alone.
The vigor of paleocirculation is measured in similar ways, using flow speed from particle grain size, geostrophy from density fields reconstructed from oxygen isotopic data, surface-to-bottom water differences in 14C ages, isotopic tracers with differing particle-related properties (e.g., 230Pa/231Th), and incorporation of nutrient proxy and isotopic tracer fields into box and general circulation models. As with the approaches to measuring modern ocean circulation, these techniques for establishing paleocirculation parameters are not, or should not be, stand-alone, but too many studies currently rely on only one of them.
Starting in the 1970s, particle grain size was used to infer deep-sea flow speed. Using the principles of sediment dynamics, McCave et al. (1995) made this technique more rigorous (see also McCave and hall, 2006). They proposed that, with particle cohesion becoming less important for sizes >10 µm, material greater than 10 µm would be sorted and deposited as individual particles, depending on their settling velocity and the flow speed at the site of deposition. The basis of the paleoflow inference is that selective particle deposition is controlled by flow speed, with higher speeds suppressing the deposition of finer sizes and slower speeds permitting it, leading to a coarser deposit from a faster flow. Fine material <10 µm has a strong tendency to form and be deposited as aggregates, whereas medium-to-coarse silt (>10 µm) particles are deposited as individual grains rather than as aggregates. This point is important because sediment has to be disaggregated for analysis, meaning that the measured finer material (<10 µm) size is not the aggregate size (or settling velocity) that was deposited. The distinction was thus made between “sortable silt,” defined as the 10–63 µm size fraction, as opposed to 2–10 µm cohesive silt whose inclusion would simply contaminate a record. Sand, coarser than 63 µm, is less common than silt and contains much material of biogenic origin. Most deep ocean currents rarely move sand of quartz density.
The parameter of size distributions used for the inference of flow speed is the “sortable silt mean size,” denoted by  , the geometric mean size of 10–63 µm material. It is usual practice to remove carbonate and opaline silica because the organisms that make their skeletons out of those materials do so at specific sizes. There are of course locations where we prefer not to do that because detrital carbonate grains are an important component of the sediment, for example, in Heinrich layers.1 A further parameter of the size distribution is the percentage of sortable silt in the total fine fraction (total <63 µm), SS%. In well current-sorted sediments, the two parameters and SS% are highly correlated (r >0.9).
For analysis of particle size, the SediGraph, based on settling velocity, is still the best method, but laser sizers and the Coulter counter are also commonly used. The issue of how particle shape influences grain size determination in clay-rich samples determined from lasers compared with other methods remains a topic requiring further work.
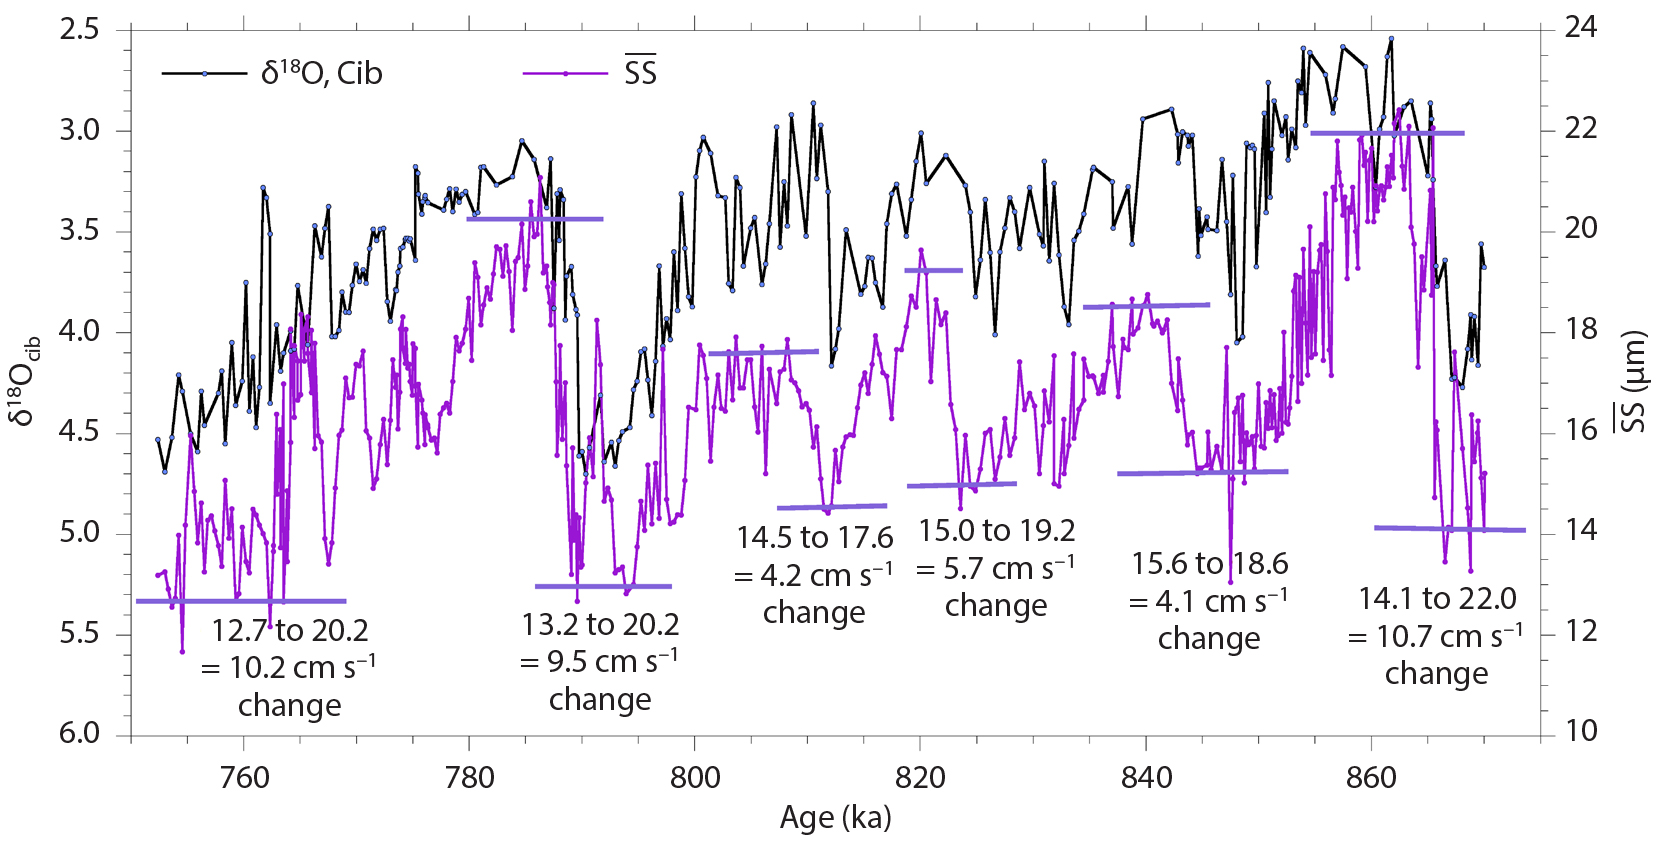
The relationship of grain size to flow speed remained unknown for some time. For many years, the parameters and SS% were simply plotted against age where they showed a close correspondence with climatic and hydrographic variables, particularly oxygen isotope ratios (Figure 1). Recently, accumulated data on the grain size of core top material collected adjacent to long-term, near-bottom current meters has been used to establish a calibration of sortable silt mean size (McCave et al., 2017). On several sediment drifts, the bottom sediments become finer down current along the transport path. In such cases, the value downstream is finer than that for the same flow speed at the upstream end of the drift. This implies that absolute calibration of to flow speed is not possible. However, the slopes of the relationships between and flow speed are very similar for the several data sets assembled by McCave et al. (2017), allowing them to be normalized by their means and plotted to give a single line. This has a slope (sensitivity) of ~1.36 cm s–1/µm, permitting us to gauge changes in flow speed implied by shifts in a grain size record. If a record is from a location near a current meter, then the coretop can be tied to an absolute flow speed.
|
|
Recent work in controlled flume experiments by Culp et al. (2020) demonstrated down-current fining and deposited grain size changes at points that are linearly related to flow speed. Their experiments yield sensitivities at locations 4.6–7.6 m from the inlet of the 9.1 m flume of 1.25–1.38 cm s–1/µm, very similar to the field calibration.
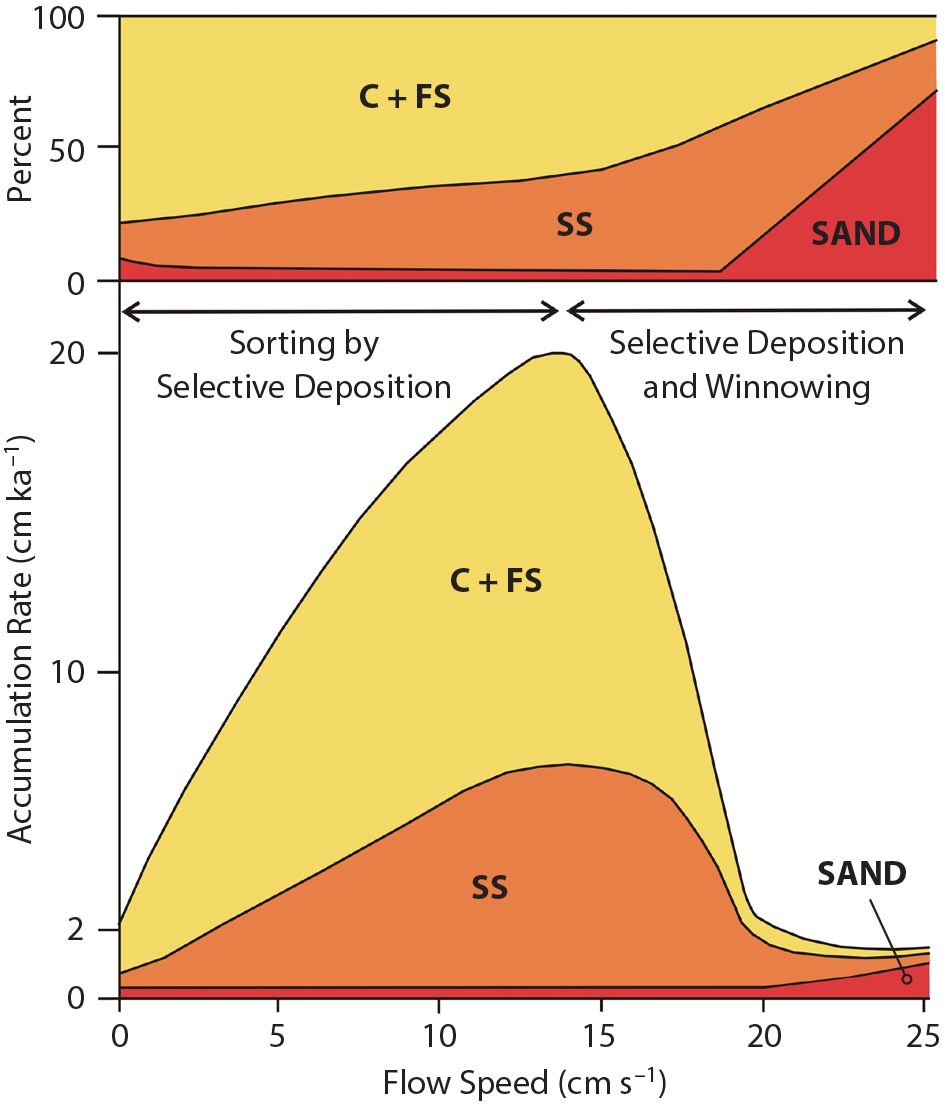
Thick accumulations of sediment, called drifts, are formed along continental margins under deep western boundary currents (DWBC) in both hemispheres. Away from major sediment sources, typical terrigenous sedimentation rates are of order 2 cm ka–1. These rates increase by at least an order of magnitude in drifts due to the advection of fine sediment from upstream sources, generally the results of downslope movements in slumps and turbidity currents. For flow speeds up to 12–15 cm s–1, it is thought that accumulation rates increase, but above that range, unsteady peak speeds start to remove material, resulting in reduced accumulation rates. And above mean speeds of 20–25 cm s–1, strong winnowing sets in and yields a sandy lag, commonly of foraminifera (Figure 2). Because of the high resolution obtainable and their key locations with regard to deep-sea circulation, drifts have been prime targets for acquisition of sedimentary records of paleoceanographic importance. DWBCs form a key component of the climatically driven global overturning circulation. Figure 1 shows an example record from Gardar Drift south of Iceland, with calibrated speed changes.
|
|
Many such records have now been generated in the North and South Atlantic, Indian, and Southwest Pacific Oceans (McCave and Hall, 2006), but little work has been done in the North Pacific because it lacks sediment drifts. Deep water flows have been the main targets of this work, but major shallow water flows are of considerable climatic interest and require attention—to name a few, these include the Gulf stream, Kuroshio Current, Antarctic circumpolar current (ACC), and East Greenland current (EGC). The ACC has been targeted because it extends to the seabed and has yielded small drifts in the Scotia Sea and the Drake passage (McCave et al., 2014). Work is needed to find suitable sediment targets for monitoring the other major upper ocean western boundary currents. Arctic shelves are deep because of glaciation, and deposits on them have provided material to assess the vigor of the EGC system, but obviously not during glacial periods (McCave and Andrews, 2019).
Grain size proxies for flow speed have an advantage in that they are dominated by local conditions, but a disadvantage in that they do not give an integrated picture of the flux. Thornalley et al. (2013) demonstrated that understanding flux requires acquiring an array of cores across the flow path. Their data show a 20% decrease in the Iceland-Scotland overflow in the past 10,000 years. Further work to collect arrays of cores, known as “dipstick coring,” down slopes where boundary currents are present is required. Upper ocean flows need to be targeted, remembering that the closer they are to the shelf edge, the greater the likelihood that storm and fluctuating sea levels influence the sedimentary record. The grain size proxy is not mediated by biology, and it primarily records depositional flow intensity. It should not be deployed alone but accompanied by hydrographic tracers (e.g., benthic δ18O, δ13C, εNd). In well-chosen locations such as DWBCs, the grain size proxy is representative of climatically driven major deep ocean flows. As long as the sediments can be disaggregated for size analysis, applications have a time span well beyond short half-life nuclides, already to the Oligocene and potentially back to the Mesozoic.
No determination of ocean circulation strength, past or present, should rely on a single method. The “sortable silt mean size,” the mean size of 10–63 µm terrigenous material, is a proxy for local bottom flow speed analogous to the modern current meter. The fact that sediments become finer down current implies that a universal absolute calibration of to flow speed is not possible. However, several grain size and near-bottom flow speed data sets normalized by their means yield a slope (sensitivity) of ~1.36 cm s–1/µm, permitting us to estimate changes in flow speed implied by shifts in a grain size record. Biology (fossil content) does not influence the proxy, and it provides a key complement to paleohydrographic tracers of water mass extent. To assess volume transports, arrays of cores across key flow paths are necessary. There is still much to do.