Introduction
Despite significant progress in the last few decades, gender inequality in science and academia remains prevalent. Women now represent approximately 50% of bachelor’s degree graduates in science and engineering. However, they earned about one-third (33.6%) of the doctorates awarded in physical and Earth sciences and just less than one-fourth (24%) of the doctorates in engineering in 2019 (NSF, 2020), and they remain significantly underrepresented in faculty positions in major research universities (NRC, 2010; NSF, 2019). Gender inequality differs significantly between scientific disciplines (NRC, 2010; Duch et al., 2012; Ceci et al., 2014). In ocean sciences, men continue to vastly outnumber women in faculty and research positions, despite women’s representing approximately 50% of doctoral degrees in oceanography (O’Connell, 2014; Orcutt et al., 2014; Wilson, 2019). The causes for this disparity are multidimensional and the object of contentious debate. A variety of factors seems to play a role: access to research funding (Hosek, 2004; Hosek et al., 2005; Shen, 2013; Ceci et al., 2014), underrepresentation in grant applications (Ley and Hamilton, 2008; Pohlhaus et al., 2011), societal pressure on work-family issues (Ceci and Williams, 2011; Thompson et al., 2011), and gender bias in hiring (Moss-Racusin et al., 2012; Sheltzer and Smith, 2014). Assessing existing gender disparities is the first step toward formulating effective policies to enhance women’s participation in science and academia.
The National Science Foundation Division of Ocean Sciences (NSF-OCE) provides the majority of the support for basic ocean research in the United States, and the availability of online data on NSF-OCE awards provides a unique opportunity to explore and examine gender differences across various factors such as scientific discipline and type of activity (e.g., research, education). Knowledge of the trends and patterns in gender differences in NSF-OCE awards across research programs and disciplines is valuable to academic institutions, decision-makers, and NSF to inform policy, measure progress toward established goals, and help find solutions tailored to the needs of individual research fields.
Here, we examine women’s participation in NSF-OCE awards between 1987 and 2019 to assess gender differences. We infer the gender of the principal investigators (PIs) and co-principal investigators (co-PIs) in the awards from their first names using data from the United States Census Bureau and other sources (Supplementary Materials Part 1), and we look at how women’s representation varies in time and across research fields, award types, and major NSF-OCE programs. Our analysis is limited to the information that is publicly available, but we are mindful that the gender information we present is not self-reported and that there is a spectrum of gender identities that are not exclusively masculine or feminine (nonbinary gender). We measure women’s participation as the percentage of women PIs and co-PIs on awards. These two metrics provide complementary information on the gender composition of different NSF-OCE programs, research topics, award types, and time periods. We also look at the relative proportion of the different categories (e.g., programs, topics, and award types) for each gender (PIs). The distribution of different NSF-OCE programs, research topics, and award types for each gender represents the research “portfolio” for that gender and therefore provides information on the gender’s makeup in terms of scientific disciplines and types of research and activities. Specifically, we look at the ratio between the percentages of awards allocated by women PIs and men PIs to each category (program, topic, and award type) and refer to this metric as the “allocation ratio.” An allocation ratio greater than one means that women PIs assign a higher proportion of their awards to that category than men do, and therefore likely have a higher percentage of PIs in that category than men. Another possible interpretation of an allocation ratio greater than one would be that proportionally women PIs submit more proposals than men PIs. However, the lower rate of grant submissions to NSF in science and engineering fields by women (Rissler et al., 2020) compared to men supports our interpretation of the allocation ratio metric. Conversely, a ratio smaller than one signifies that men have a higher proportion of PIs in that category than women. A more detailed explanation of how the allocation ratio metric is computed is included in Supplementary Materials Part 2. Knowledge of the different genders’ compositions with respect to research fields and types of activities can be helpful in interpreting observed gender differences across different programs, research topics, and award types.
Temporal Trends
The share of women investigators in NSF-OCE awards shows steady and significant growth, increasing from about 10% in 1987 to approximately 30% in 2019 (Figure 1). The difference between the temporal trends (slopes) in the percentages of women PIs and co-PIs is not statistically significant, and women’s participation in NSF-OCE awards is growing at an overall rate of approximately 0.6% per year (Table 1). Comparison with the academic workforce data for Earth, atmospheric, and ocean sciences (NSF, 2019) shows that women’s participation in the workforce has been increasing at a similar rate (Figure 1, Table 1). The somewhat lower percentage of women in the workforce is most likely a result of the inclusion of Earth and atmospheric sciences in the workforce data (in addition to ocean sciences), as ocean sciences generally have a higher proportion of women compared to the other two fields (Wilson, 2019). Note that the workforce data do not include individuals without doctoral degrees. The strong similarities between the trends in women’s participation in the NSF-OCE awards and the academic workforce indicate that the observed upward trend in women’s representation in NSF-OCE awards reflects the increasing participation of women in the ocean sciences academic workforce, and that there is no gender bias in NSF funding. This conclusion is supported by a recent study of grant submissions and funding success in six NSF science and engineering directorates, including Geosciences (Rissler et al., 2020). In the sections below, we use a linear trend fitted to the combined PI and co-PI data (Figure 1) as a proxy for women’s representation in the ocean sciences academic workforce and as a reference for comparisons with women’s participation across NSF-OCE programs, research fields, award types, and time periods.
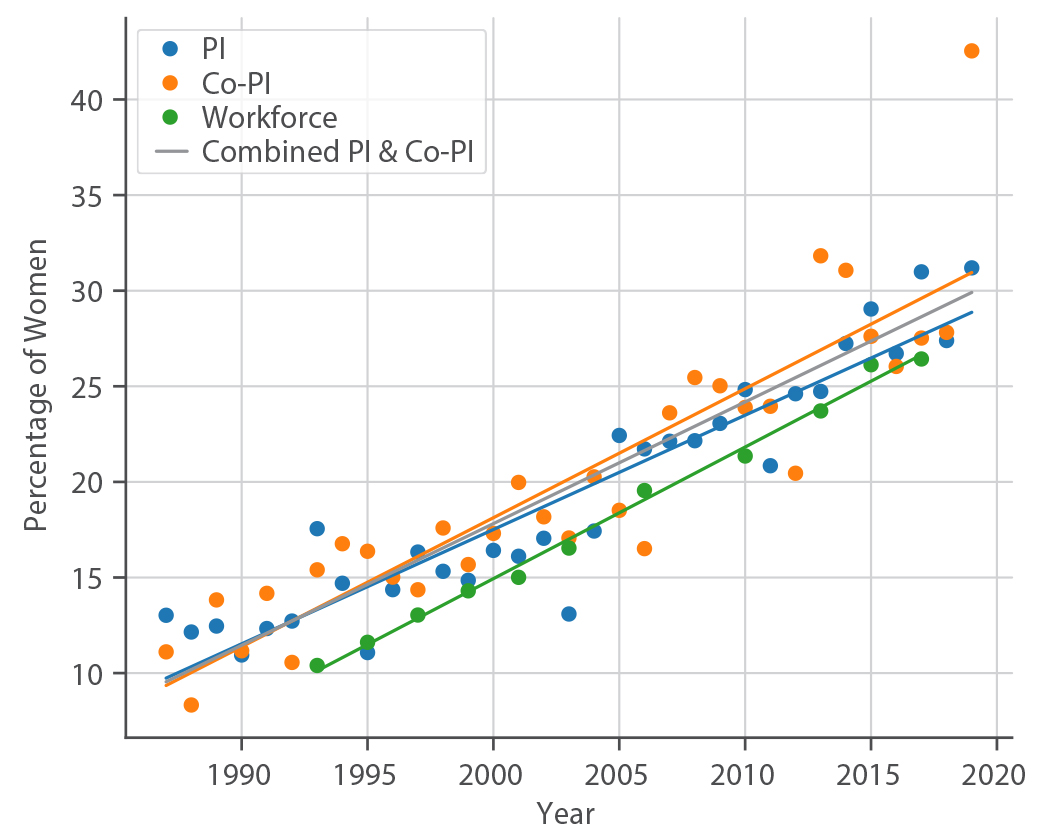
FIGURE 1. Annual mean percentages of women principal investigators (PIs) and co-PIs in National Science Foundation Division of Ocean Sciences (NSF-OCE) awards, and of women in the academic Earth, atmospheric, and ocean sciences workforce. The lines represent the linear regression fits for each category (PI, co-PI, and academic workforce). The gray line represents the linear regression fit for the combined PI and co-PI data. Table 1 shows the parameter values for the different linear regression fits. The academic workforce data were obtained from NSF’s Survey of Doctoral Recipients, a biennial survey conducted through the National Center for Science and Engineering Statistics (NCSES) to provide demographic information about individuals holding doctoral degrees in science, engineering, or health fields from US academic institutions (SDR; NSF, 2019). > High res figure
|
TABLE 1. Parameter values for the linear regressions presented in Figure 1. > High res table

|
NSF-OCE Programs
Women’s participation and its evolution over time varies significantly across the 10 largest NSF-OCE programs (Figure 2). Combined, these programs represent approximately 86% of all NSF-OCE awards and over 55% of the NSF-OCE budget. In biological oceanography (BO), women’s representation as PIs and co-PIs increased at a similar rate, consistently surpassing the growth in women’s participation in the workforce, despite a modest increase (<2%) from 1987–1997 to 1998–2008. The proportion of biological oceanographers among women PIs is approximately 50% higher than that of men PIs (mean allocation ratio = 1.50). The percentages of women PIs and co-PIs in marine geology and geophysics (MGG) also grew at a comparable rate (~0.6% per year) and seem to approximately track women’s participation in the workforce. The proportion of MGG PIs among men and women is approximately the same (mean allocation ratio = 1.07). In chemical oceanography (CO), women have higher representation as co-PIs than as PIs, and the share of women co-PIs is somewhat larger than that in the workforce. However, women’s participation as PIs in chemical oceanography (CO) consistently underperforms that of the workforce in all three time periods. The proportion of women and men PIs in CO is approximately the same (allocation ratio = 0.95). Despite the share of women PIs and co-PIs in physical oceanography (PO) more than doubling from 1987–1997 to 2009–2019, growth in women’s participation has lagged behind that of the workforce. Women also have a smaller proportion of physical oceanographers (~17% less) than men (mean allocation ratio = 0.83).
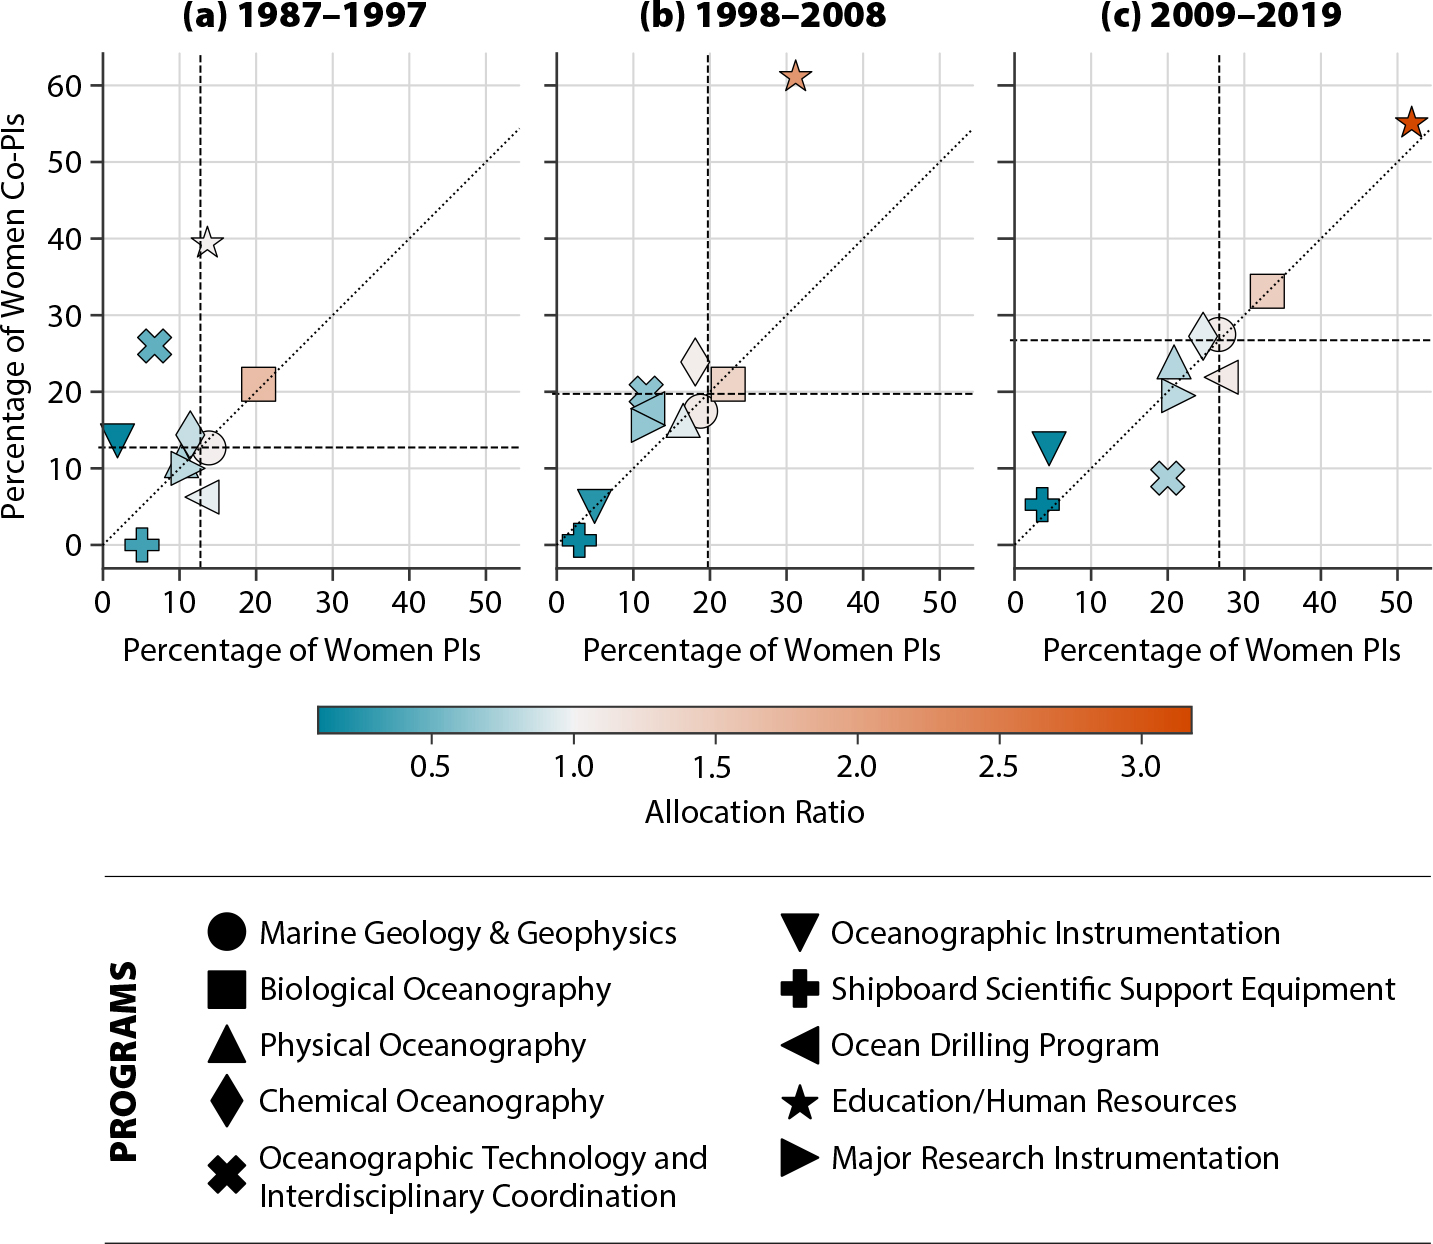
FIGURE 2. Scatter plot of the percentages of women PIs vs co-PIs for the 10 largest NSF-OCE programs (in numbers of awards) in three different 11-year periods: (a) 1987 to 1997, (b) 1998 to 2008, and (c) 2009 to 2019. The dotted diagonal line represents the 1:1 ratio. The vertical and horizontal dashed lines represent the mean percentages of women in the academic workforce for the time period computed from the linear trend fitted to the combined PI and co-PI data for all awards (Figure 1). The programs in the upper right quadrant of each panel have higher women’s participation than the academic workforce for both PIs and co-PIs while those in the lower left quadrant have lower participation than the workforce for both PIs and co-PIs. For the programs in the lower right quadrant, women’s participation as PIs is higher than in the workforce, but participation as co-PIs is lower than in the workforce. Conversely, for programs in the upper left quadrant, women’s participation as co-PIs is higher than in the workforce, but participation as PIs is lower than in the workforce. The marker color represents the allocation ratio. An allocation ratio greater than one means that women PIs assign a higher proportion of their awards to that program than men do, and vice-versa, and provides an indicator of the relative proportion of women to men PIs in that particular program. > High res figure
|
The Oceanographic Technology and Interdisciplinary Coordination (OTIC) program shows opposite trends for women PIs and co-PIs. While the percentage of women PIs increases from 6.7% (1987–1997) to 20% (2009–2019), that of co-PIs declines from 26% to 8.7% in the same period. Despite considerable growth, women’s representation as PIs in OTIC also trails that of the workforce by approximately seven percentage points. The clear decline in women’s participation as co-PIs in OTIC is surprising, as most other programs show either an increase or no significant change in women’s participation. The proportion of women PIs involved with instrument development and facilities improvement is also considerably lower (25%–50%) than that of men (allocation ratio between 0.50 and 0.75). Women’s participation both as PIs and co-PIs in oceanographic instrumentation (OI) and shipboard scientific support equipment (SSSE) is very low in comparison with the other programs and the workforce and shows no significant change over time, except for a modest increase in the percentage of women co-PIs in SSSE (from 0% to 5%). The PIs involved with the development of seagoing oceanographic instrumentation and equipment also comprise a much smaller proportion (65%–90% less) of women than men (allocation ratio between 0.10 and 0.35). In the Ocean Drilling Program (ODP), women’s participation as PIs (13%) is higher than as co-PIs (6.25%) in 1987–1997 and comparable to that in the workforce. However, growth in representation is uneven between PIs and co-PIs. The percentage of women PIs in the ODP declines by 1% from 1987–1997 to 1998–2008 but increases significantly (15%) from 1998–2008 to 2009–2019, while the share of women co-PIs shows strong growth (11%) from 1987–1997 to 1998–2008 but a relatively modest increase (4%) from 1998–2008 to 2009–2019. The share of women PIs working on scientific ocean drilling is similar to that of men (mean allocation ratio = 0.91). This result is consistent with that for MGG, as most PIs in the ODP are also funded by MGG.
Women’s participation as co-PIs in education and human resources is significantly higher than in the other programs and the workforce, ranging between 39% and 61%, with an average of 52% for the entire study period (1987–2019). Most of the growth in representation in this program has been in the PI category, increasing from 14% (1987–1997) to 52% (2009–2019), achieving and surpassing parity with men. The proportion of awards from women PIs allocated to education and human resources increases from approximately the same as men in 1987–1997 (allocation ratio = 1.03) to more than three times that of men in 2009–2019 (allocation ratio = 3.18). This indicates that the share of women PIs participating in education has grown much faster than those involved in other programs, and now comprises a much larger proportion of women PIs compared to men.
The Major Research Instrumentation (MRI) program started in 1997, so the women’s participation estimates for 1987–1997 are based on a small number of awards (9) and therefore not representative of the period. From 1998–2008 to 2009–2019, women’s representation as PIs increases faster than as co-PIs, but overall participation remains well below that of the workforce. Despite its similarities with the OTIC, OI, and SSE programs in terms of type of projects, MRI shows greater improvement in women’s participation than these other related programs for both PIs and co-PIs. The proportion of women PIs working on the development of costly research instrumentation is 20%–35% smaller than that of men (allocation ratio between 0.65 and 0.80). However, the share of women PIs in MRI is noticeably higher than in other similar programs such as OI and SSSE.
Research Topics
Research topics provide better insight into specific subjects within each NSF-OCE program. Therefore, we apply topic modeling to the award abstracts to reveal underlying research topics and examine how women’s participation varies across different research fields. Topic modeling is an effective tool for analyzing the thematic structure of large collections of documents (Blei and Lafferty, 2009; Blei, 2012; Mohr and Bogdanov, 2013). Topic models identify groups of words that occur together frequently in the documents and that can be related to a theme or topic. Probabilistic topic models have been used to study the time evolution of topics in 120 years of the journal Science (Blei and Lafferty, 2006; Blei, 2012) and to identify research and funding trends in NSF-OCE awards (Lima and Rheuban, 2018). Here, we extract 21 research topics from the award abstracts using a matrix decomposition method (see Supplementary Materials Part 3 for details). The most frequent words in the extracted topics (Figure 3) show subjects related to: (1) coastal circulation, (2) shipboard equipment, (3) ship instrumentation, (4) ocean ridge geology, (5) physical circulation processes, (6) population ecology and fisheries, (7) impact of environmental degradation on coral reefs, (8) science communication, (9) marine carbon chemistry, (10) sedimentary processes, (11) geochemistry of hydrothermal vents, (12) instrumentation development, (13) large scale oceanic circulation, (14) trace elements and isotopes, (15) marine primary production, (16) ship operations, (17) education and outreach activities, (18) microbiology and genomics, (19) plate tectonics, (20) marine nitrogen cycle, and (21) paleoceanography. Hereafter in the text and figures, we refer to the different topics using their three most frequently occurring words (Figure 3).
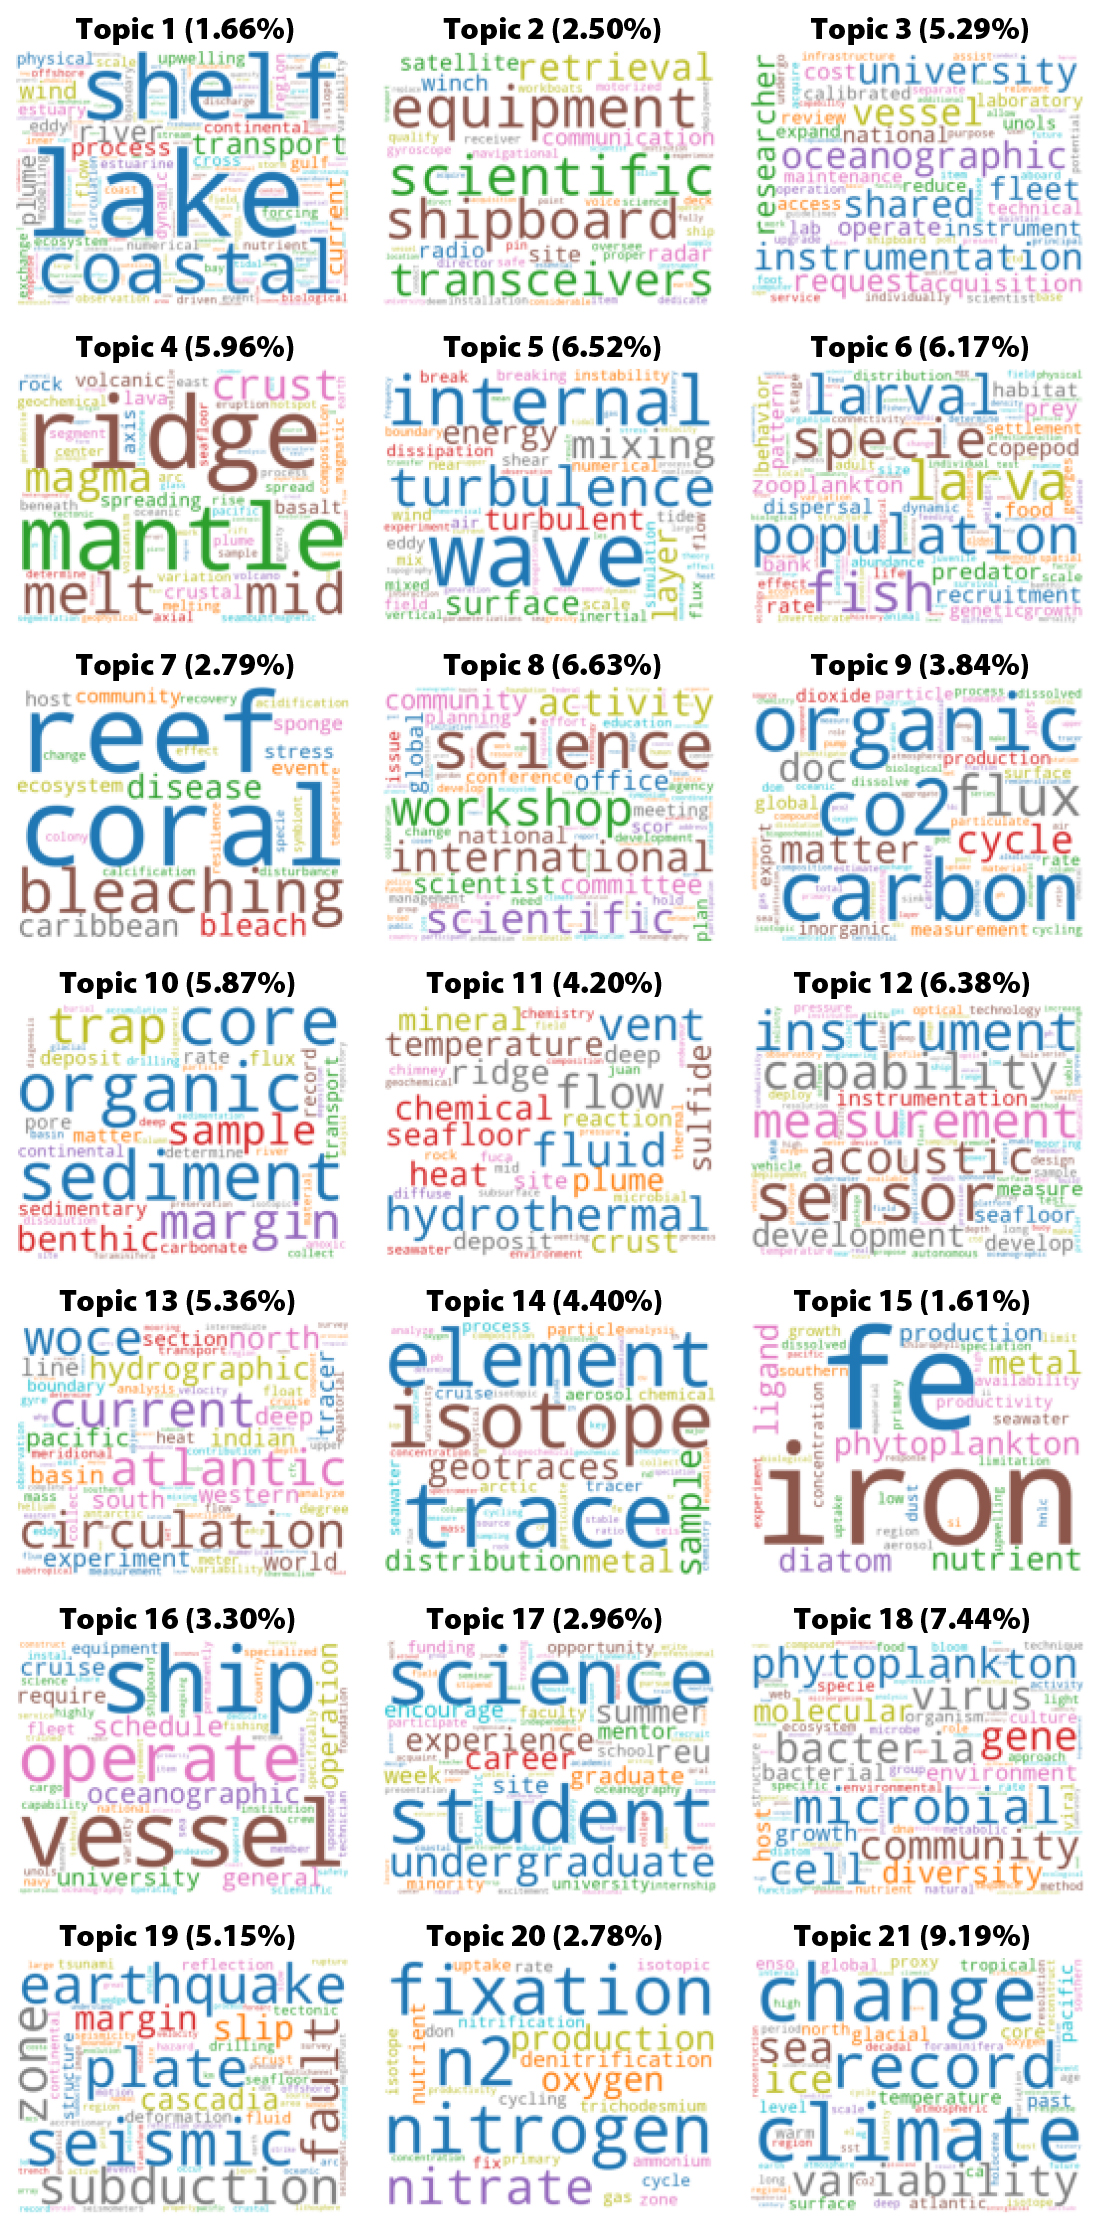
FIGURE 3. Word cloud plots of the extracted research topics (see text for list of topics). Word size is proportional to its frequency in the topic. The percentage of awards in each topic is shown in parentheses next to the topic number. > High res figure
|
The distribution of the different research topics with regard to women’s participation as PIs and co-PIs in different time periods (Figure 4) shows that initially (1987–1997), most topics are clustered around the workforce mean. With time, the different topics spread along the 1:1 ratio line, denoting markedly different rates of change in women’s participation across different topics. Consistent with what we see in the programs (Figure 2), women’s participation in the topics related to education and human resources (topics 8 and 17) shows remarkable growth and achieves near parity with men. The topics associated with shipboard equipment and instrumentation and ship operations (topics 2, 3, and 16) show relatively small changes in women’s representation. The topic sensor instrument measurement (12) shows a slow but noticeable increase (14%) over time in women’s participation, mainly as PIs, similar to what we see for the MRI program. Despite the relatively steady rise in women’s participation in the four major science programs, namely MGG, BO, PO, and CO, growth in women’s representation in the topics within these programs is uneven and often erratic, with increases in the percentages of women PIs and co-PIs followed by declines and vice versa. All four topics in BO show gains as well as drops in the percentages of women PIs and co-PIs during the study period. However, all 21 topics show a net growth in women’s participation either as PIs or co-PIs between 1987–1997 and 2009–2019 (Table S2). The topics with the highest mean net increases include workshop science international (8), student reu science (17), circulation woce atlantic (13), seismic earthquake plate (19), climate change record (21), coral reef bleaching (7), and carbon organic co2 (9), while the topics with the smallest net gains are equipment scientific shipboard (2), vessel ship operate (16), instrumentation university shared (3), and hydrothermal vent fluid (11). The topics vessel ship operate (16) and instrumentation university shared (3) are noteworthy for showing a net decrease in the percentage of women PIs between 1987–1997 and 2009–2019. Similar to what we see in the NSF-OCE programs, women’s representation tends to be higher than that in the workforce in the topics for which the proportion of women PIs is larger than that of men (allocation ratio >1), and vice versa (Figure 4).

FIGURE 4. Scatter plot of the percentages of women PIs vs co-PIs for the 21 extracted research topics in three different 11-year periods: (a) 1987 to 1997, (b) 1998 to 2008, and (c) 2009 to 2019. The dotted diagonal line represents the 1:1 ratio. The vertical and horizontal dashed lines represent the mean percentage of women in the academic workforce for the time period computed from the linear trend fitted to the combined PI and co-PI data for all awards (see section on Temporal Trends and Figure 1). The topics in the upper right quadrant of each panel have higher women’s participation than the academic workforce for both PIs and co-PIs, while those in the lower left quadrant have lower participation than the workforce for both PIs and co-PIs. For the topics in the lower right quadrant, women’s participation as PIs is higher than in the workforce but participation as co-PIs is lower than in the workforce. Conversely, for topics in the upper left quadrant, women’s participation as co-PIs is higher than in the workforce but participation as PIs is lower than in the workforce. The marker color represents the allocation ratio. An allocation ratio greater than one means that women PIs assign a higher proportion of their awards to that topic than men do, and vice-versa, and provides an indicator of the relative proportion of women to men PIs in that particular topic. The topic legends are grouped and colored according to the NSF-OCE program. Blue represents topics in marine geology and geophysics and the Ocean Drilling Program, orange represents topics in biological oceanography, green represents topics in physical oceanography, red represents topics in chemical oceanography, purple represents topics associated with instrumentation development (Oceanographic Technology and Interdisciplinary Coordination and Major Research Instrumentation program), brown represents topics related to ship instrumentation and operations (ocean instrument and shipboard scientific support equipment), and cyan represents topics in education and human resources. > High res figure
|
Award Types
The different NSF-OCE award types (Supplementary Materials Part 1), besides the traditional or “standard” grants, represent different types of research or research-related activities that include larger collaborative projects involving PIs from multiple institutions (Collaborative Research), high risk-high reward exploratory research (EAGER), rapid-response research on natural or anthropogenic disasters or events (RAPID), research opportunities for undergraduates (REU) and faculty at predominantly undergraduate institutions (RUI/ROA), and early career faculty projects combining research and education (CAREER). EAGER, RAPID, REU, RUI, and CAREER awards represent a relatively small fraction of the total number of awards (10%) and dollar amounts (<5%), while “standard” and Collaborative Research awards comprise the majority of NSF-OCE awards (90%) and consume most of the dollar amounts (>95%) (Tables S3 and S4). The number of Collaborative Research awards increased markedly over the last 30 years, and in 2019 they represented approximately 34% of the total number of awards and 48% of the total amount awarded (Figure S1). This trend reflects a major shift in scholarly practice in the ocean sciences towards larger collaborative projects.
Women’s representation increases at different rates across the different award types during the study period (Figure 5). Women’s participation either as PIs or co-PIs grew more noticeably in EAGER, RAPID, REU, CAREER, and RUI awards than in standard and Collaborative Research awards. The low percentage of women PIs in RAPID in 1987–1997 and 1998–2008 (Figure 5a,b) is probably not representative based on the low number of awards (4) in that category in those periods. The number of RAPID awards then grows significantly, increasing from four awards in 1987–1997 and 1998–2008 to 203 awards in 2009–2019. There were only 10 CAREER awards in 1987–1997, so the high percentage of women PIs in that category is probably not representative as well. Consistent with what we see in the NSF-OCE programs and research topics, the largest overall net increases in women’s participation between 1987–1997 and 2009–2019 are observed in CAREER and REU awards, which have strong educational components. These types of awards also comprise a higher percentage of women PI’s awards compared to men’s, indicating that a higher proportion of women PIs are involved in education (allocation ratio between 1.20 and 2.50). The higher percentage of awards allocated by women to EAGER in 1987–1997 and 1998–2008 (allocation ratio between 1.23 and 1.55) suggests that a larger fraction of women PIs work on high risk-high reward exploratory research compared to men. Collaborative Research awards show a slightly higher average increase (PIs and co-PIs) in women’s participation between 1987–1997 and 2009–2019 than standard awards, which is significant given the rising trend in collaborative projects in the last few decades. The higher proportion of women PIs relative to men (allocation ratio >1) in EAGER, RAPID, REU, CAREER, and RUI awards in the last decade (Figure 5c) indicates that women are making better use of these different types of awards and that they have a more diversified “portfolio” of research and research-related activities than men.
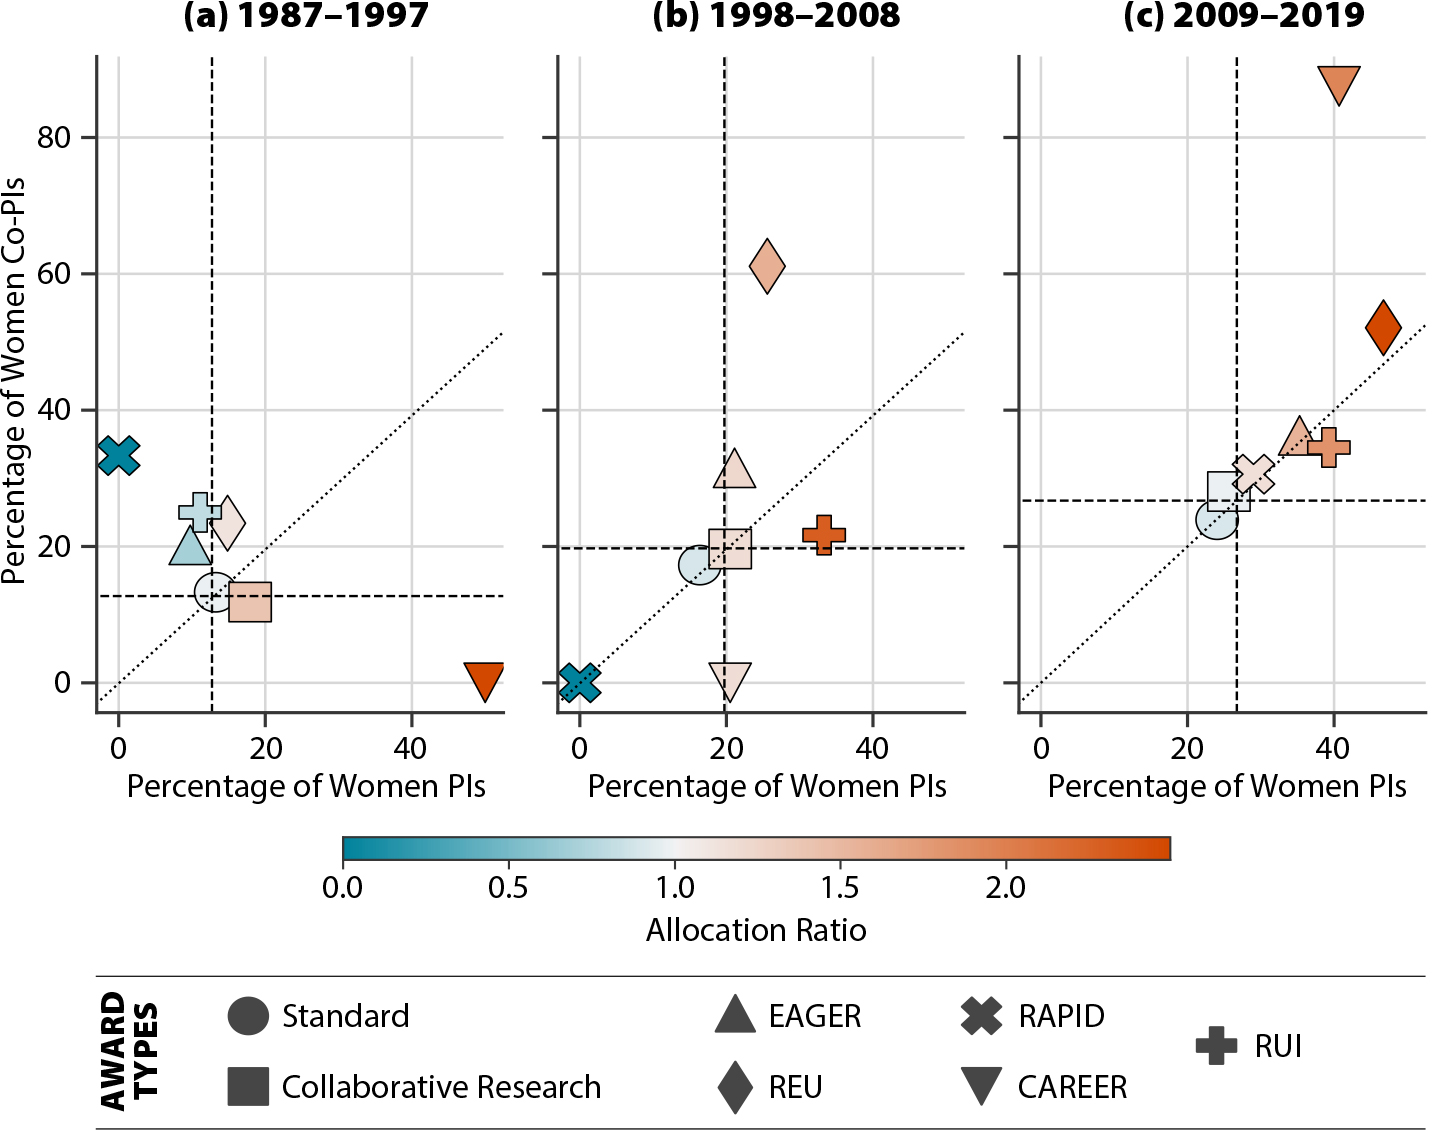
FIGURE 5. Scatter plot of the percentages of women PIs vs co-PIs for the different NSF-OCE award types in three different 11-year periods: (a) 1987 to 1997, (b) 1998 to 2008, and (c) 2009 to 2019. The dotted diagonal line represents the 1:1 ratio. The vertical and horizontal dashed lines represent the mean percentage of women in the academic workforce for the time period computed from the linear trend fitted to the combined PI and co-PI data for all awards (see section on Temporal Trends and Figure 1). The award types in the upper right quadrant of each panel have higher women’s participation than the academic workforce for both PIs and co-PIs while those in the lower left quadrant have lower participation than the workforce for both PIs and co-PIs. For the award types in the lower right quadrant, women’s participation as PIs is higher than in the workforce but participation as co-PIs is lower than in the workforce. Conversely, for award types in the upper left quadrant, women’s participation as co-PIs is higher than in the workforce but participation as PIs is lower than in the workforce. The marker color represents the allocation ratio. An allocation ratio greater than one means that women PIs assign a higher proportion of their awards to that award type than men do, and vice-versa, and provides an indicator of the relative proportion of women to men PIs in that particular award type. > High res figure
|
Gender Differences and Patterns
It is difficult to draw conclusions on the causes of the observed gender differences across NSF-OCE programs, topics, and award types from the available award data. Project size (amount awarded) and team size (number of co-PIs) can be used as proxies for research resource requirements. Analysis of the distribution of projects and team sizes shows significant variations across programs, topics, and award types (Figures S2 and S3). However, the lack of correlation between those variations and the observed gender disparities suggests that the differences in women’s representation across programs, topics, and award types and their deviations from the workforce mean cannot be explained by differences in resource requirements. The amount by which women’s representation in the individual programs, topics, and award types differs from the workforce mean is mainly a function of the relative proportion of women to men PIs in the respective categories (Figures 2, 4, and 5). Programs, topics, and award types in which the proportion of women PIs is higher than that of men (allocation ratio >1) have higher women’s representation than the academic workforce. Conversely, categories with a lower proportion of women PIs than men PIs (allocation ratio <1) have lower women’s representation than the workforce. Generally, the larger the difference in the relative proportion of women and men PIs, the larger the deviation from the workforce mean. Nonetheless, the underlying causes of the differential changes in gender composition in the scientific disciplines within ocean sciences remain unclear (Ceci and Williams, 2011; Thompson et al., 2011; Larivière et al., 2013; Shen, 2013). The programs with the lowest women’s representation, OI and SSSE and their associated topics (2, 3, and 16), are related to the acquisition of shared-use instrumentation and equipment for research vessels. OI and SSSE proposals are generally submitted by the institution’s technical services manager or the marine superintendent. These positions are more technical and managerial and therefore somewhat different from the traditional scientific PI track. The low women’s representation in OI and SSSE compared to the other programs may be related to differences between these professional tracks and may identify an opportunity for additional investment in workforce development, training, and retention of women in this area.
A recent study of grant submissions to NSF in six science and engineering directorates, including Geosciences (Rissler et al., 2020), found no evidence of gender bias in funding and that women tend to be more heavily involved in teaching and education than men. Our results strongly support these conclusions. The similar rate of increase in women’s representation in the academic workforce and NSF-OCE awards also suggests the absence of gender bias in funding decisions. The strong engagement of women in education and mentoring is evident in the NSF-OCE programs, research topics, and award type data. The fact that women in academic institutions spend more time on teaching and mentoring than men is well documented (Babcock et al., 2017; O’Meara et al., 2017). Women are also more likely than men to be employed in teaching-intensive positions or institutions (Ceci and Williams, 2011; Eagly, 2020), and whether this is the result of personal choices or societal expectations is the subject of intense debate (Ceci and Williams, 2011; O’Meara et al., 2017). Analysis of the distribution of award sizes also shows no evidence of gender bias in the amount awarded to men and women PIs. The difference between the mean award size for women and men is not statistically significant, and the distribution of award sizes for both genders is very similar (Figure S4).
To investigate differences in collaboration patterns, we examine the number and gender composition of co-PIs by PI gender. The distribution of the percentage of women (or men) co-PIs by PI gender shows a significant degree of gender homophily in co-PI choice. Both men and women PIs have a higher percentage of co-PIs of the same gender, and the differences are statistically significant (Figure S5a). Gender homophily in collaborator choice is relatively common (Mcdowell and Smith, 1992; Bozeman and Corley, 2004), and given that men vastly outnumber women in the ocean sciences, homophily would imply that women generally have fewer opportunities to collaborate than men. However, the distribution of the number of co-PIs by PI gender shows the opposite, where on average, women have a higher total number of co-PIs than men. The difference is small but statistically significant (Figure S5b). These results are consistent with the higher participation of women in Collaborative Research awards compared to “standard” awards (Figure 5), and they are supported by studies that show that women researchers tend to collaborate more than men (Bozeman and Gaughan, 2011; Abramo et al., 2013). The observed difference in collaboration pattern is particularly relevant given the importance of collaboration in promoting research productivity and impact (Landry et al., 1996; Hicks et al., 2010; Larivière et al., 2015).
Summary and Conclusions
Here, we show that there has been a substantial increase in women’s participation in NSF-OCE awards in the last three decades. However, gender differences vary significantly across different disciplines and changes within specific fields and programs over short time periods (a few years) are often uneven and erratic. This has implications for studies looking at short-term changes in women’s representation, as year-to-year fluctuations may dominate the signal and significantly impact their conclusions. We also show that women in the ocean sciences are strongly engaged in education and mentoring and that, despite being greatly outnumbered by men, they tend to do more collaborative work and have a more diversified “portfolio” of research and research-related activities. We found no evidence of gender bias in NSF-OCE funding. However, the gender disparities identified here indicate that women scientists still face intrinsic and systemic biases, and that a lot of work remains to be done to improve women’s participation in the ocean sciences. We hope that the information presented here will be useful to academic institutions and decision-makers for informing investment and hiring decisions, designing policies and solutions to remedy some of the identified gender disparities, and improving diversity, equity, and inclusion in our universities and research institutions.
Data and Code Availability
The data used in this study are publicly available on the NSF web site (https://www.nsf.gov/) and the code used to process and analyze the data is available at our GitHub repository (https://github.com/WHOIGit/nsf-oce-gender). Interactive visualizations of some of the results are also available at https://idlima.github.io/nsf_gender/.
Acknowledgments
We thank G. Packard, J. Huber, S. Legg, M.A. Holmes, and one anonymous reviewer for their comments and suggestions. NSF deserves special thanks for making its data publicly available.