Introduction
The world ocean holds vastly more carbon than the atmosphere (~60 times more during preindustrial times). Therefore, a relatively small change in the oceanic carbon inventory can lead to a large change in atmospheric pCO2 and thus in global climate. Also, the large capacity of the ocean to store carbon means that perturbations to atmospheric pCO2 can be damped by the ocean through air-sea CO2 exchange. The timescale of change for the ocean spans decades to centuries, much longer than those for the atmosphere or the land biosphere. Thus, the ocean has long been considered key to understanding global carbon cycle changes that occurred over glacial-interglacial timescales and that are likely to occur on decadal to centennial timescales in the future.
One of the important drivers of the ocean carbon cycle is the biological pump, the vertical transport of carbon from the surface to the deep ocean by sinking particulate organic matter (POM). This carbon export process can sequester carbon in the ocean interior for centuries until overturning circulation returns it to the surface. As Broecker (1982) first proposed, changes in the strength of the biological pump can alter the amount of carbon sequestered in the ocean and has the potential to drive large variations in atmospheric pCO2. For example, strengthening of the pump can reduce pCO2 and often requires increasing the oceanic inventories or surface supply rates of limiting nutrients such as phosphorus (Broecker, 1982), nitrogen (Falkowski, 1997), and iron (Martin, 1990). Here, we aim to examine a new twist to the biological pump under climate change, namely, how flexible elemental stoichiometry of phytoplankton modifies carbon export as the marine environment changes. This idea was originally suggested by Peter Weyl to Broecker (1982) in the context of glacial pCO2 and subsequently mentioned infrequently in the literature. Our goal in this work is to introduce how this twist might manifest under glacial conditions (Matsumoto et al., 2020) as well as under future warming conditions (recent work of authors Matsumoto and Tanioka), for which environmental drivers are arguably more easily understood.
Redfield Ratio and Flexible C:N:P
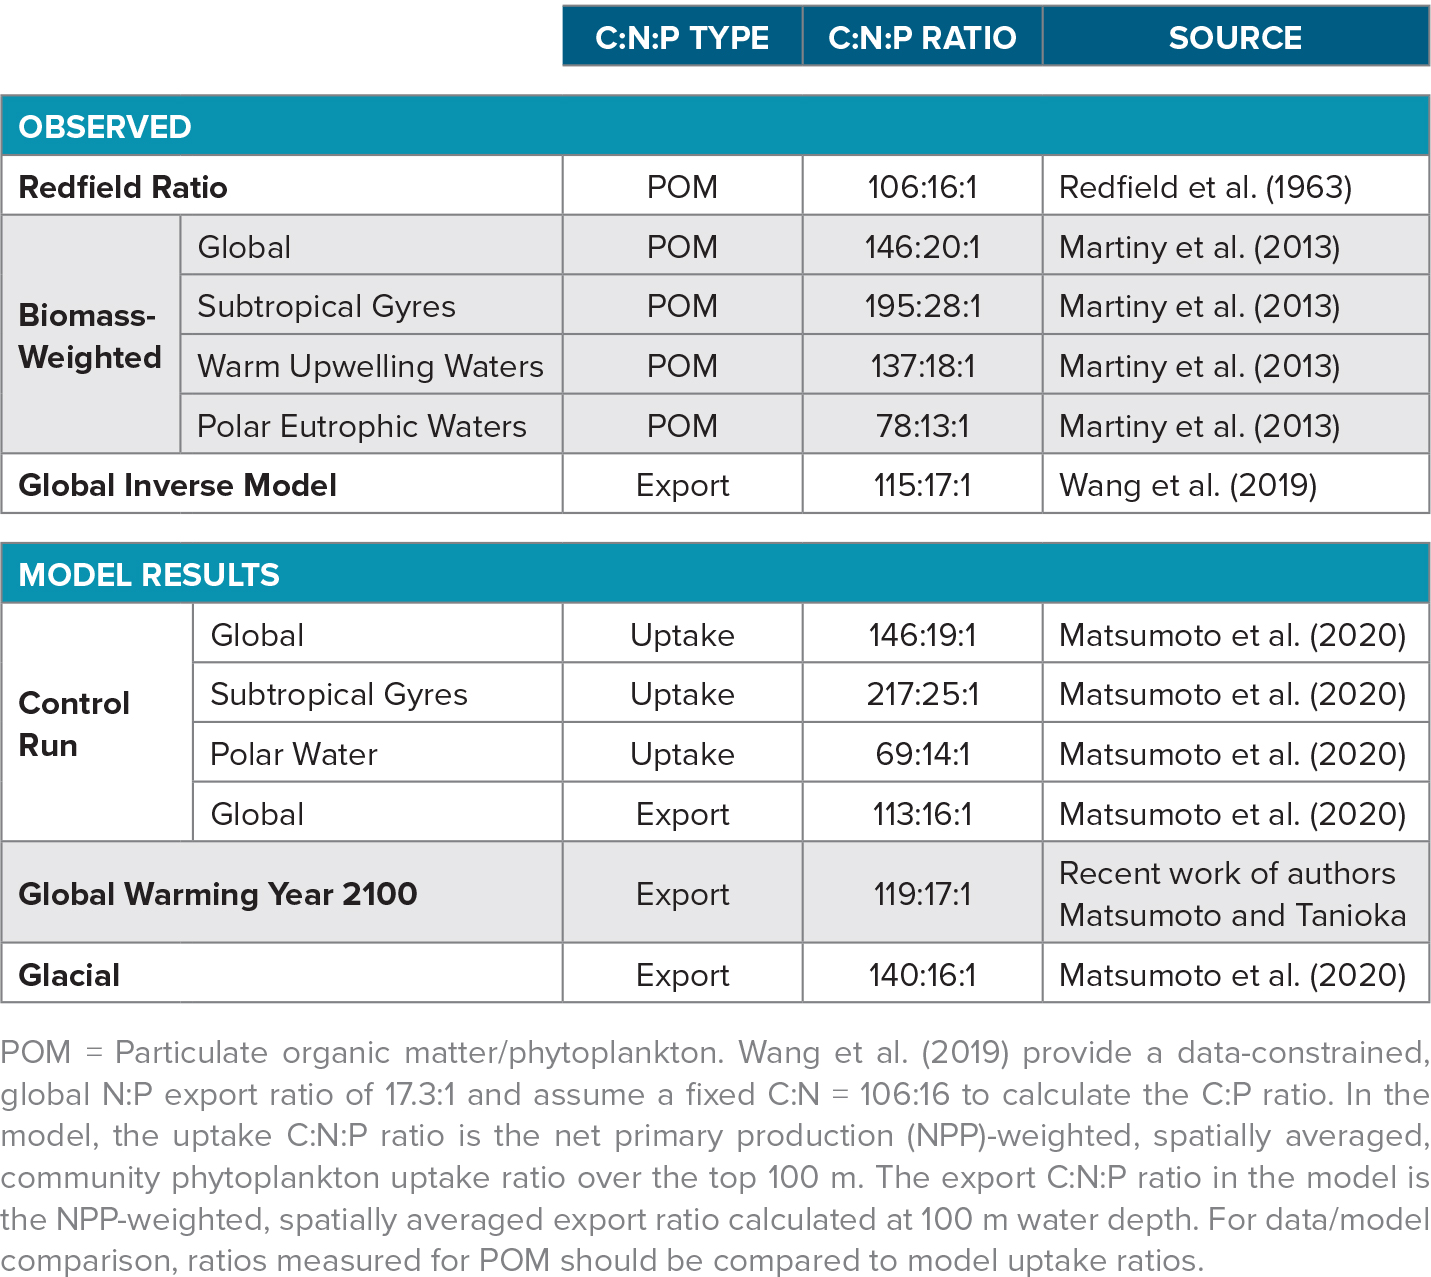
The possibility that phytoplankton stoichiometry of carbon, nitrogen, and phosphorus (C:N:P) could be flexible on an ocean basin scale has not been considered seriously until recently. The stability of the C:N:P ratio has been a central tenet of chemical oceanography since the seminal work by Redfield (1934). He discovered that the stoichiometry in plankton and seawater was very similar. The so-called Redfield ratio of marine organic matter is C:N:P = 106:16:1 (Redfield et al., 1963). Later, L.A. Anderson (1995) extended it to oxygen, –O2:P = –150:1. The Redfield ratio is very useful in studies of ocean carbon budgeting, and chemical oceanographers have long assumed the Redfield ratio or some variations of it to be fixed. For example, just a decade ago the international modeling community used a fixed ratio in the Ocean Carbon Cycle Model Intercomparison Project (Najjar et al., 2007). However, biologists have long known plankton stoichiometry to be quite variable in individual cells. Indeed, Redfield himself noted stoichiometric flexibility. Furthermore, a strict C:N:P ratio does not seem to be supported by any obvious physiological or biochemical underpinning (Geider and La Roche, 2002).
In recent years, evidence has been mounting of substantial variability in the stoichiometry of phytoplankton and particulate organic matter (POM), even at the ocean basin scale. For example, Martiny et al. (2013) find a clear global pattern that shows an elevated C:N:P ratio of 195:28:1 in the subtropical gyres, 137:18:1 in the warm upwelling zones, and 78:13:1 in the nutrient-rich polar regions (Table 1). An inverse model of ocean biogeochemistry also inferred a similar spatial pattern of global C:N:P ratio (Teng et al., 2014; Wang et al., 2019). This variability is not fully understood, but nutrient availability, especially that of phosphate, is clearly recognized as a driver. Also, stoichiometric measurements on different taxa reveal that eukaryotes have relatively low C:N:P, more consistent with the Redfield ratio, which is perhaps not surprising given that Redfield’s original measurements were made on eukaryotes. Modern measurements on much smaller cyanobacteria, not yet discovered in Redfield’s day, show distinctly higher ratios, with C:P as high as 350 and N:P as high as 50.
Today, the global ocean modeling community is transitioning from fixed to dynamic stoichiometry for phytoplankton. For example, the stoichiometric flexibility represented by the state of the art CMIP5/6 models range from none at all (i.e., fixed C:N:P) to partial flexibility (e.g., flexible C:P but fixed C:N) to full flexibility (Bopp et al., 2013; Arora et al., 2019). This flexibility has important implications not only for the glacial carbon cycle but also for future uptake of anthropogenic carbon by the ocean. For example, the traditional view of the future biological carbon pump is that it will become weaker as warming enhances ocean stratification and reduces the vertical supply of nutrients from the subsurface to the sunlit surface layer. However, the concept of flexible stoichiometry allows for the possibility that the biological carbon pump may remain relatively unperturbed in the face of reduced nutrient supply because the reduction should lead to higher phytoplankton C:P. In other words, changes in phytoplankton stoichiometry could buffer carbon export against change. Previous modeling studies indicate that the ocean’s capacity to uptake anthropogenic carbon in the future due to variable C:P alone is quantitatively modest (Tanioka and Matsumoto, 2017).
A major challenge in transitioning to a more fully flexible phytoplankton C:N:P ratio in ocean biogeochemical models is the deficiency in understanding which environmental factors drive the flexibility. A cursory survey of the literature does not give a clear picture (e.g., Moreno and Martiny, 2018). There are numerous reports of laboratory incubation experiments that indicate phytoplankton stoichiometry dependence with a conflicting sense of change (e.g., how temperature affects C:N:P ratio). Also, different studies target different strains of algae, often under dissimilar conditions.
In order to overcome this challenge, we conducted an exhaustive meta-analysis of laboratory studies of marine phytoplankton stoichiometry (Tanioka and Matsumoto, 2020). Meta-analysis is a powerful statistical framework for synthesizing independent studies and identifying trends, and it follows rigorous formal protocols to ensure reproducibility and reduce bias. We analyzed 241 experimental units of P:C and 366 experimental units of N:C from 104 journal articles encompassing seven taxonomic phyla.
Figure 1 illustrates the main findings of the meta-analysis regarding the sensitivities of C:P and C:N uptake as functions of phosphate, nitrate, light, and temperature. Sensitivity to iron was included in the meta-analysis but is excluded here due to a significant but very small signal that was seen in only one class of phytoplankton. Our meta-analysis confirmed that C:P increases as P becomes more limiting (Figure 1a) and also as temperature rises (Figure 1b). Additionally, C:N increases as N becomes more limiting (Figure 1c) and as light increases (Figure 1d). The meta-analysis shows that the stoichiometric sensitivities differ in terms of their statistical significance, magnitude, and universality across different taxonomic groups. For example, the effect of phosphate on C:P is much larger for eukaryotes than for other phytoplankton types examined, and the effect of temperature is not statistically significant in eukaryotes. The interested reader is referred to the meta-analysis in Tanioka and Matsumoto (2020) for a discussion of the underlying biochemical reasons.
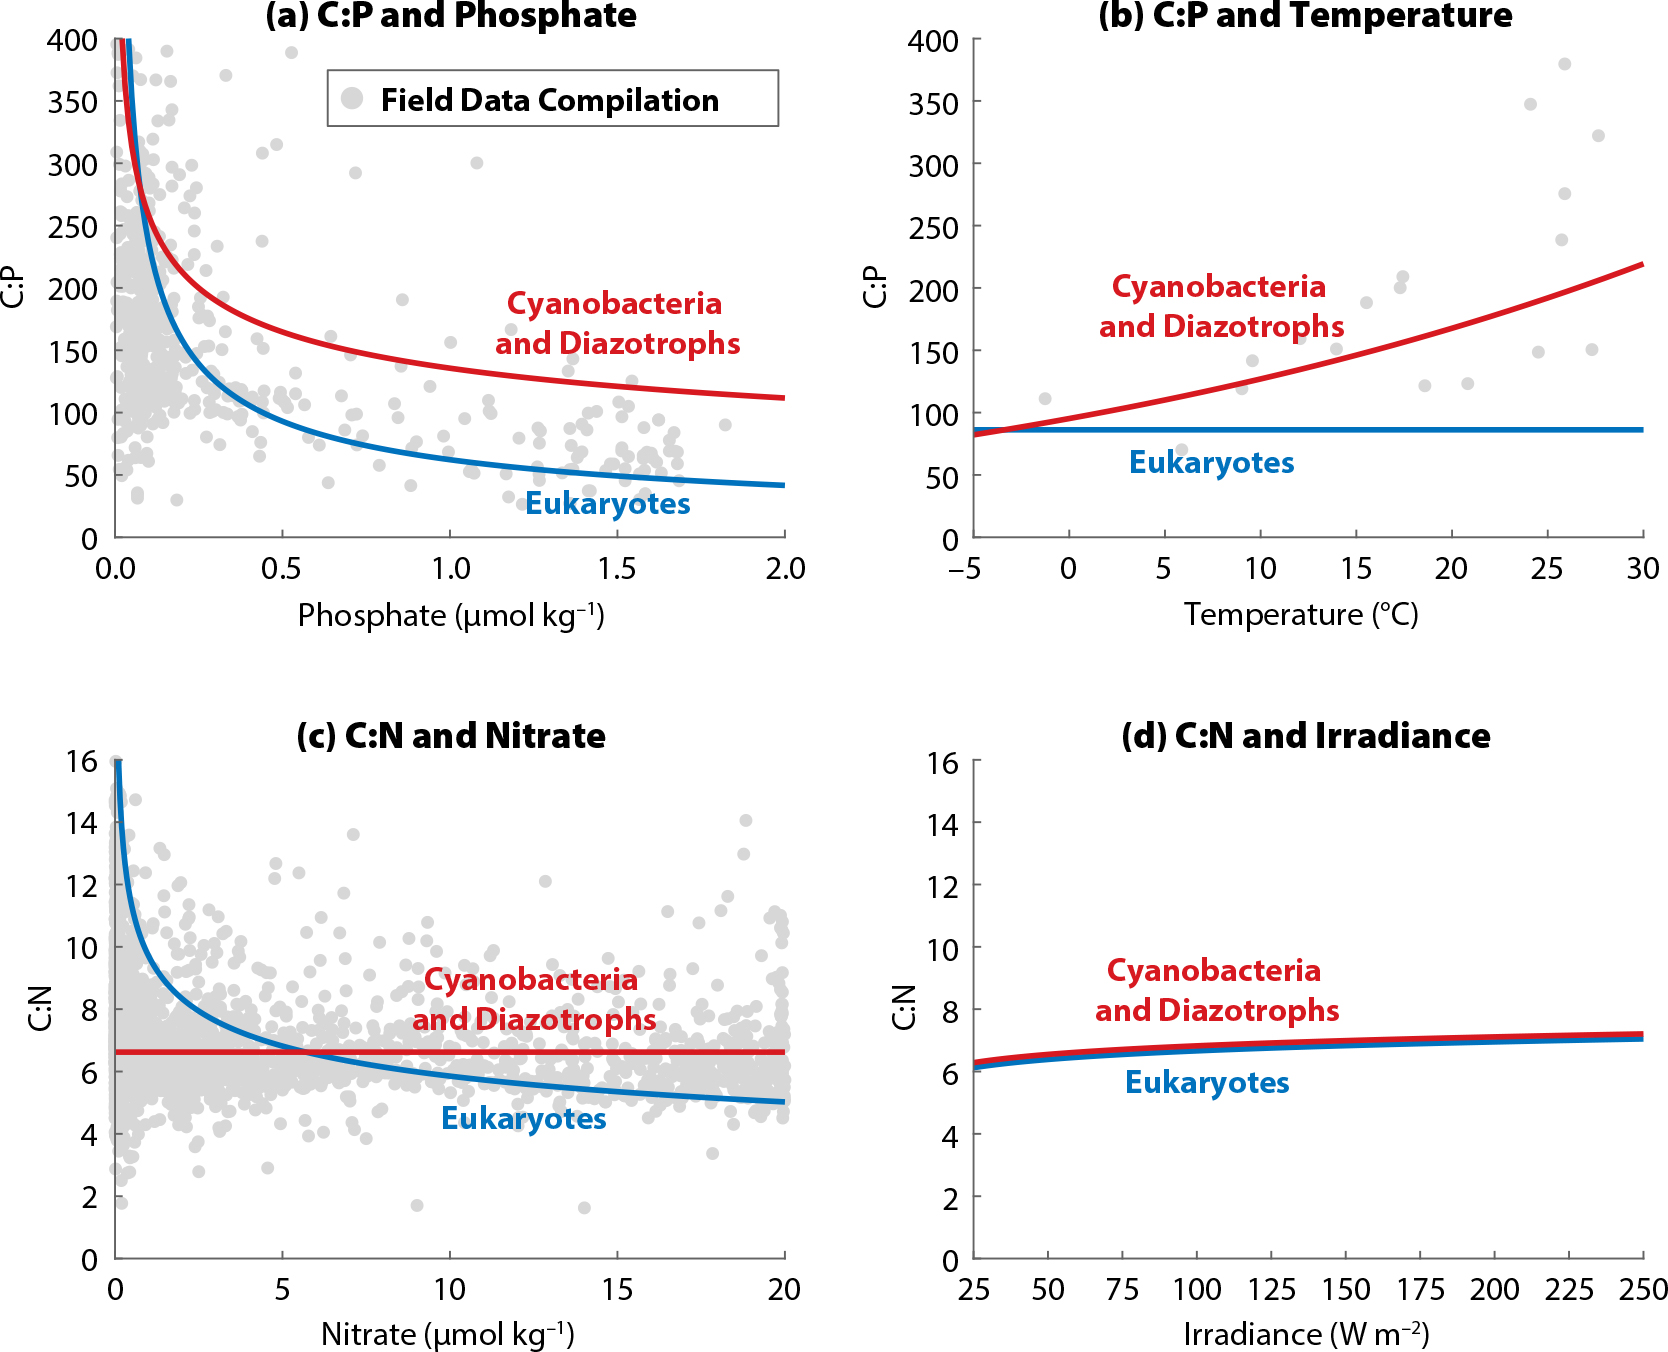
Figure 1. C:P and C:N ratios of three phytoplankton groups as functions of four environmental drivers with sensitivities from the meta-analysis of Tanioka and Matsumoto (2020). In each panel, only one driver is changed while others are kept constant at reference values. The gray dots are C:P and C:N data of bulk particulate organic matter from the field. (a) and (c) from Galbraith and Martiny (2015) and (b) from Yvon-Durocher et al. (2015). > High res figure
|
With global warming, water temperatures will rise, and the water column will likely stratify more strongly, providing more light to phytoplankton in a thinner mixed layer and resulting in reduced vertical supply of phosphate and nitrate to the surface. According to the sensitivities of the C:P and C:N ratios (Figure 1), these environmental changes will elevate C:P or C:N so that phytoplankton should become more carbon rich. In this simple thought experiment then, higher carbon content in phytoplankton should lead to greater carbon export, but coupled with lower overall productivity, global carbon export will be buffered into the future.
Flexible C:N:P in the Control Model Run
Whether and how much this stoichiometric buffering occurs in a more realistic setting can be explored by implementing the C:P and C:N sensitivities shown in Figure 1 in a global model of ocean biogeochemistry. We have employed a coarse resolution three-dimensional Earth system model called MESMO (Minnesota Earth System Model for Ocean biogeochemistry; Matsumoto et al., 2013) for this purpose. Details of the implementation are available in Matsumoto et al. (2020). Here, we note briefly that three phytoplankton functional types (PFTs) are represented in the flexible C:N:P-enabled MESMO: eukaryotes, cyanobacteria, and diazotrophs. Eukaryotes, which include diatoms, are fast and opportunistic growers, especially under nutrient replete conditions. Cyanobacteria such as Prochlorococcus and Synechococcus are smaller cells that do well in oligotrophic waters. Diazotrophs are nitrogen fixers that exhibit slow growth rates but are not limited by nitrate. The growth patterns of these PFTs are limited by temperature, light, and different combinations of nutrients (P, N, Fe, and Si). Base model states for the three PFTs, including nutrient limitation maps, are presented in Matsumoto et al. (2020). In the model, the base C:N:P ratio is set lower for eukaryotes and higher for the other two PFTs as observed, and the three PFTs are given different C:N:P sensitivities, according to the meta-analysis findings. For example, all PFTs have C:P dependence on phosphate, but eukaryotes are the most sensitive compared to the others.
The MESMO control run, prescribed with preindustrial boundary conditions and described by Matsumoto et al. (2020), shows a number of features that indicate good starting points for exploring the effect of flexible stoichiometry on the ocean carbon cycle (Figure 2). For example, in the oligotrophic subtropical gyres of the model, where carbon export production is low, cyanobacteria are dominant (Figure 2a) and C:P is high (Figure 2b). The phytoplankton community C:P is high in the subtropical gyres, because low phosphate concentrations elevate the C:P ratio for all PFTs and because cyanobacteria make the largest contribution to the community. In contrast, the community C:P is low in eutrophic and polar waters because the nutrient replete conditions reduce C:P in all PFTs and eukaryotes are dominant. Community C:P in our model is largely consistent with the observed C:P ratio of particulate organic matter on the global scale (compare black line and squares in Figure 2b).
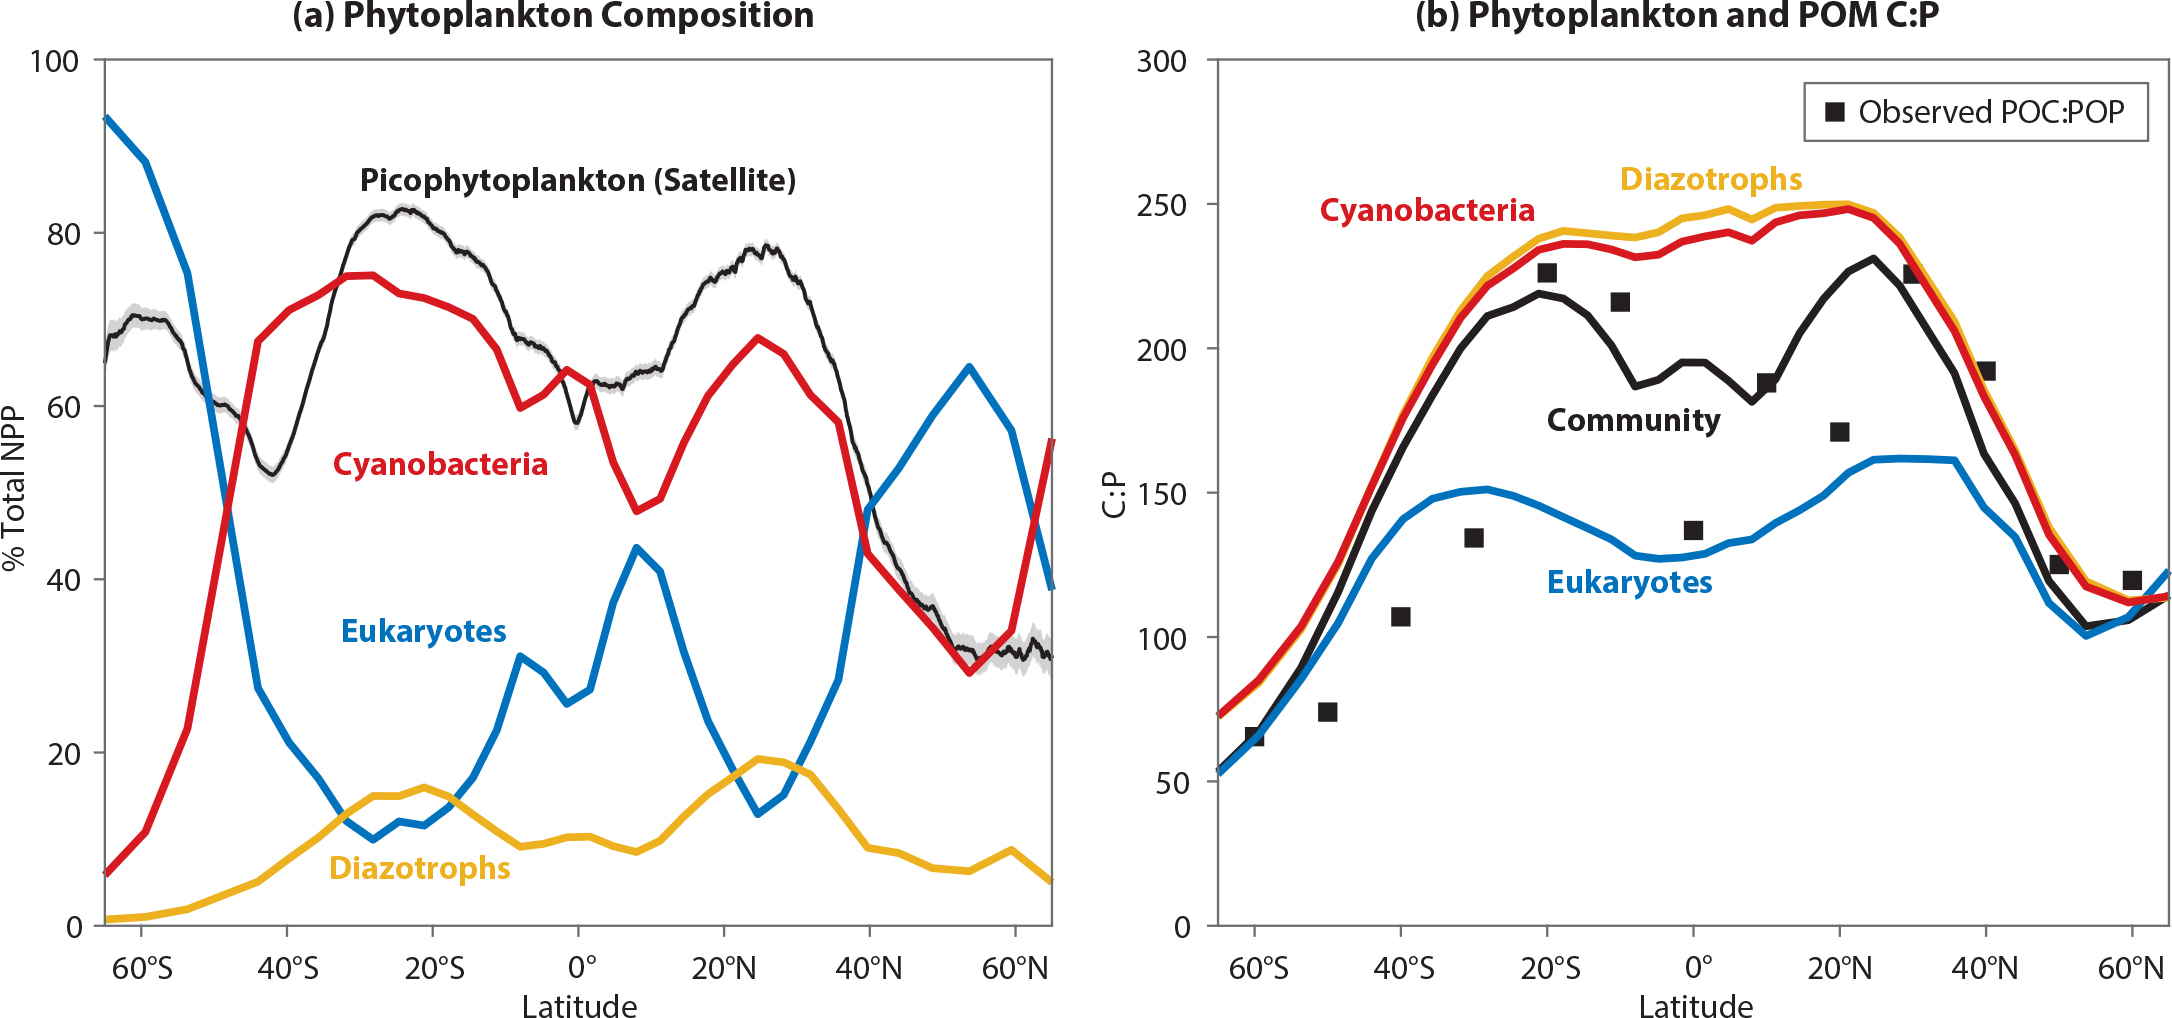
Figure 2. Annual mean properties in the control model for the top 100 m of the water column. (a) Zonally averaged, net primary production (NPP)-weighted phytoplankton community composition. The three phytoplankton functional types (PFTs) represented in the model are eukaryotes (blue), cyanobacteria (red), and diazotrophs (yellow). The black line is the remotely sensed contribution of picophytoplankton (0.5–2 µm) to total carbon-based biomass (Kostadinov et al., 2016). (b) Zonally averaged C:P uptake ratios for each PFT (colored lines) and the NPP-weighted community C:P (black line). The community C:P would be reflected in the C:P ratio of organic particles. Black squares are based on data from C:P from Martiny et al. (2013). > High res figure
|
Globally, the control model predicts C:N:P uptake of 102:14:1 for eukaryotes and much higher uptake ratios for cyanobacteria and diazotrophs (C:N:P = 198–213:23–32:1) within the production layer. The global mean phytoplankton community C:N:P uptake ratio is 146:19:1 (Table 1). The model predicts the highest C:N:P uptake ratio in the topmost level within the production layer, because the surface is where nutrients are most depleted and light levels and temperatures are the highest. The C:N:P uptake ratio becomes lower with depth in the production layer. Export C:N:P ratio at any site reflects the uptake ratios carried by POM formed at different levels within the production layer. The model currently includes no preferential remineralization of different elements. The global mean export C:N:P in the control model is 113:16:1, which is close to the Redfield ratio (Table 1). The difference between the phytoplankton uptake ratio and the export ratio is thus a consequence of having an environment-driven, flexible stoichiometry. Such a difference does not manifest in the model where phytoplankton C:N:P uptake ratio is fixed.
Flexible C:N:P Under Global Warming
All future MESMO simulations are carried out under a new “middle-of-the road” scenario for future warming called the Shared Socioeconomic Pathway 2 (Riahi et al., 2017). The summary presented here is based on multiple sensitivity model experiments carried out recently by authors Matsumoto and Tanioka. The model simulates typical climate warming features that include warming of surface air and sea surface, slowdown of the Atlantic meridional overturning circulation, and shallower mixed layer and sea ice retreat in polar waters. Radiative forcing stabilizes at ~4.5 Wm–2 with pCO2 at around 600 µatm by the year 2100. We show results from our global warming simulation for the year 2100. There are two important drivers of global export C:N:P changes in our model simulation. First, global sea ice coverage retreats from approximately 10% to 6.5%, leading to enhanced biological production in the previously ice-covered Southern Ocean (Figure 3a). This has the effect of depleting surface nutrients there, thus elevating the C:N:P of all Antarctic PFTs and increasing the Southern Ocean’s contribution to global production. Second, higher temperatures increase the C:P ratio for cyanobacteria and diazotrophs. This temperature effect has a significant impact on community C:P outside the Southern Ocean (Figure 3c).
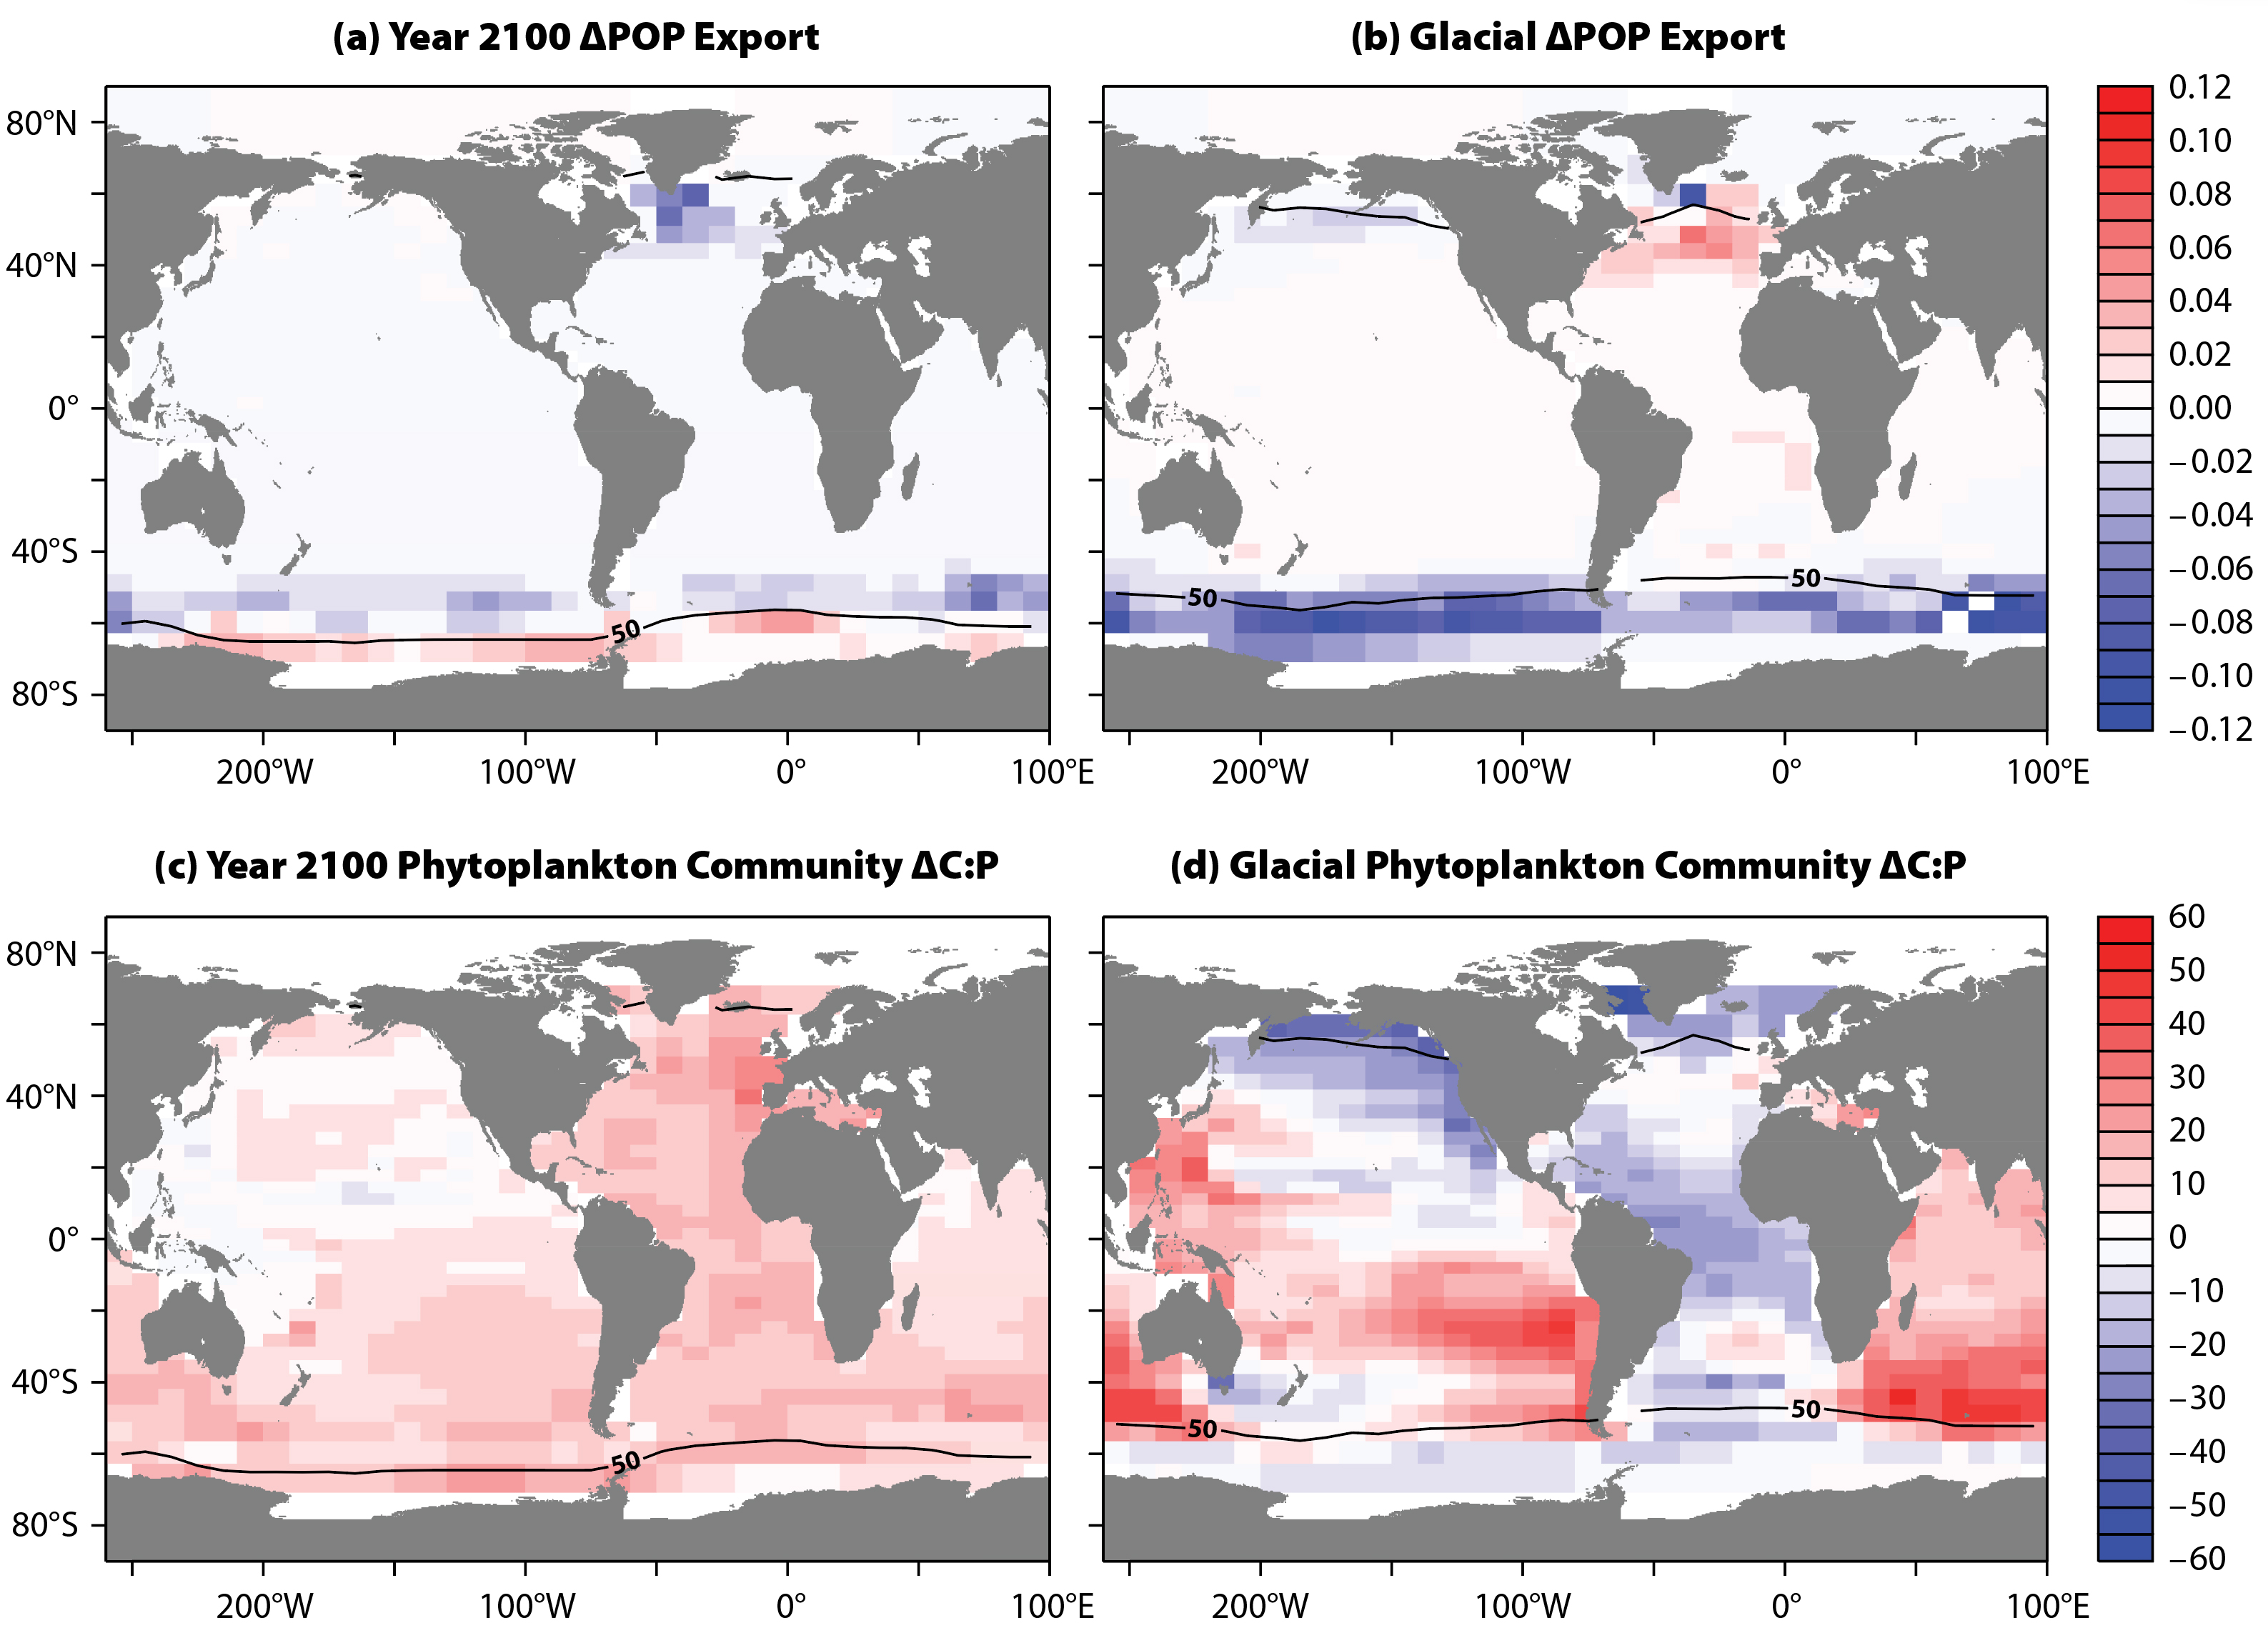
Figure 3. Experiment-minus-control changes under global warming and glacial conditions. The change in particulate organic phosphorus (ΔPOP)export (mole-P m–2 yr–1) for (a) year 2100, and (b) glacial. Phytoplankton community ΔC:P (molar ratio) for (c) year 2100 and (d) glacial. The black line indicates mean annual sea ice coverage of 50% (e.g., 100% coverage for half a year) predicted by the model under prevailing climate conditions. > High res figure
|
In the warming simulation, the global mean export C:N:P increases for two main reasons. First, physiologically, the global mean C:N:P for eukaryotes increases because of the large reduction in nutrient availability in the Southern Ocean. The same effect is simulated for cyanobacteria and diazotrophs but is smaller due to their lower C:P sensitivities to phosphate limitation. Outside the Southern Ocean, where the nutrients were already much lower or even close to being completely depleted, the temperature effect on cyanobacteria and diazotroph C:P becomes large. The second reason that the global export C:N:P rises is the change in regional production. While biological production declines globally (due generally to increased stratification), the Southern Ocean is anomalous in showing an increase in production as sea ice retreats. As noted above, the strong, nutrient-driven physiological response of Antarctic phytoplankton stoichiometry, especially by eukaryotes, makes a larger contribution to the global mean. In other words, the stoichiometry of the PFTs from the more productive waters would make a larger contribution to the global mean than the stoichiometry of the PFTs from less productive waters. Interestingly, the shift in community composition under global warming is modest and has little effect on global C:N:P. As expected, a shift in favor of the smaller cyanobacteria occurs at the expense of the larger eukaryotes in the model, as nutrients generally become more depleted. However, the shift is only ~3% globally. In an earlier modeling study with a very different formulation of flexible stoichiometry, Kwiatkowski et al. (2018) also found a similar taxonomic shift by ~2% by the year 2100 and attributed 95% of the global change in C:N:P to physiology.
Under the warming scenario adopted here, MESMO predicts that the global export C:N:P ratio increases from 113:16:1 in the preindustrial state to 119:17:1 by the year 2100 (Table 1). During this period, the global P export by particles (POP) declines by 14%. In a separate model run where phytoplankton C:N:P was fixed, the global carbon export declined by the same proportion as P export, as expected. However, the simulated carbon export decline is only 10% with flexible stoichiometry export. The stoichiometric buffering effect (BE) of carbon export can be quantified as
 |
where fPOC and fPOP are the fractional changes in particulate organic carbon (POC) and POP since preindustrial times. In this case, 1 – fPOC = 0.10 and 1 – fPOP = 0.14. BE is thus 30%. As export C:N:P increases under warming, it facilitates a larger uptake of anthropogenic carbon under the prescribed atmospheric pCO2. However, the net transport of air-sea CO2 flux is driven overwhelmingly by the prescribed pCO2 itself (i.e., large air-sea pCO2 gradient), so that the effect of flexible C:N:P on anthropogenic carbon is quantitatively insignificant. In our study, the extra anthropogenic carbon uptake due to a higher export C:N:P ratio is just ~1% by the year 2100, similar to the estimate of 0.5%–3.5% by Kwiatkowski et al. (2018).
Flexible C:N:P Under Glacial Conditions
We find that the lessons gleaned for the global warming case are generally applicable to the glacial model simulation. In the glacial simulation, the same flexible C:N:P-enabled ocean model was subject to five conditions that are often used in glacial model studies: larger land ice (albedo), reduced radiative forcing from greenhouse gases, insolation changes due to Earth’s orbital parameters, increased dust deposition, and weaker Southern Hemisphere westerly winds. A whole suite of glacial model runs with various sensitivities indicated are described in detail in Matsumoto et al., 2020 and are used to draw the general conclusions summarized here.
In the glacial simulation, the application of ice albedo and radiative forcing substantially cools the planetary surface (>5°C in global mean surface air temperature) and has the important effect of expanding the polar sea ice by 64%. In stark contrast to the global warming simulation, the increase in sea ice under glacial conditions has the effect of dramatically reducing biological production in the Southern Ocean (Figure 3b). This reduced contribution in turn leads to an increase in the global export C:N:P, because the Southern Ocean with high nutrients (which drives C:N:P lower) and eukaryote-dominated PFTs (which, again, drives C:N:P lower) now has a reduced influence on the global mean.
A comparison of sensitivity runs with and without glacial dust flux demonstrates that the increased dust deposition in the glacial model run also has important consequences for global export C:N:P through a chain of events. Iron from dust has a direct fertilization effect on PFTs in places where Fe is limiting. More critically for this study, the iron input impacts the physiology of diatoms as previously suggested in the silicic acid leakage hypothesis (Matsumoto et al., 2002), which predicts that increased iron availability will reduce the Si:N uptake ratio of diatoms, leaving silicic acid underutilized in much of the world’s surface ocean. As theorized, this relieves the severe silicic acid limitations that diatoms exhibit in the control model run. As a result, production by the eukaryote PFT is enhanced outside areas of expanded sea ice. Global eukaryote carbon export thus increases substantially from 3.6 Pg-C yr–1 to 6.3 Pg-C yr–1. This eukaryote growth comes at the expense of cyanobacteria growth and depletes surface nutrients because eukaryotes have high growth rates. As a consequence, global mean surface phosphate concentration decreases from 0.31 µmol-P kg–1 to 0.26 µmol-P kg–1 in the model, although phosphate in polar waters increases because the expanded sea ice suppresses biological production. Interestingly, in our model, nitrate becomes decoupled from phosphate in the Southern Ocean surface waters by showing a decline. In the model, the nitrate decline reflects a reduction in the global nitrate inventory, a consequence of weaker southern westerlies reducing deep ocean ventilation, enhancing deoxygenation, and finally promoting a faster rate of denitrification.
The chain of events triggered by the glacial iron input has two important impacts on global C:N:P. First, the depletion of nutrients elevates the C:N:P uptake ratio according to the sensitivities of C:P and C:N illustrated in Figure 1. This physiological response is strongest in eukaryote C:P, which increases everywhere outside the polar waters. The global mean C:N:P for eukaryotes thus increases from 102:14:1 to 152:16:1. Cyanobacteria and diazotrophs exhibit similar, but weaker, stoichiometric responses to nutrients. Also, their C:P becomes lower with cooling. Their overall change in C:N:P is thus mixed, with nutrients raising the ratio and cooling lowering it. Community C:N:P represents a balance of these physiological changes and a general shift in community composition in favor of eukaryotes.
A first glance at the map of experiment-minus-control changes under glacial conditions in Figure 3d gives the impression that the C:P increase in the Indian and much of the Pacific Oceans is balanced by C:P reduction in the Atlantic and North Pacific. However, the global mean C:N:P is given by the production-weighted average. As already noted, the global mean C:N:P is proportionately influenced by the ratios of the more productive waters, and very little influenced by the low ratios of the largely ice-covered Southern Ocean under glacial conditions. The global mean export C:N:P ratio is therefore decidedly higher under glacial conditions, 140:16:1, compared to the control run, 113:16:1 (Table 1). There is thus a 24% increase in the carbon content in the sinking POM per unit P.
In terms of the buffer equation presented above, fPOP = 0.77 and fPOC = 0.95 for the glacial simulation. That is, while P export decreased by 23%, carbon export only declined by 5%, which indicates BE = 79%, a very strong buffering of carbon export.
The elevated export C:N:P ratio under glacial conditions could help to explain the glacial levels of atmospheric pCO2. As first demonstrated in the 1980s with Antarctic ice core records, pCO2 was lower during peak glacial times by 80–100 µatm than during interglacial periods (e.g., Petit et al., 1999). A comparison of the glacial-minus-control runs with and without flexible C:N:P suggests that having flexible stoichiometry reduces pCO2 by approximately 20 µatm. This quantification is not without difficulty, but it is on par with the changes in pCO2 achieved by other mechanisms such as solubility.
Are the glacial model predictions reasonable? Our model prediction of deep deoxygenation is consistent with recent paleo-proxy studies concluding that many parts of the glacial ocean, including the deep Atlantic and the equatorial Pacific, had substantially lower [O2] during the last glacial period than today (e.g., Lu et al., 2016; R.F. Anderson et al., 2019). In the Southern Ocean, the literature supports the predictions of sea ice expansion and diminished Antarctic productivity during the last glacial period. A reconstruction of Antarctic sea ice based on fossil diatoms recovered from sediment cores indicates that the maximum limit of Antarctic winter sea ice extended northward by 5°–10° latitude in all sectors of the Southern Ocean (Crosta et al., 1998). It is likely that as sea ice expands, biological production under sea ice will be diminished and surface nutrients will be underutilized and accumulate, as our results indicate. Indeed, a summary of biological production during the glacial period indicates reduced production in Antarctic waters (Kohfeld, 2005). Also, different nutrient proxies in Antarctic waters indicate increases in surface nutrient concentrations, for example, foraminiferal Cd/Ca (Elderfield and Rickaby, 2000), diatom δ30Si (De La Rocha et al., 1998), and δ13C of organic matter bound to diatoms (Shemesh et al., 1993).
However, these surface nutrient proxies have long been at odds with sedimentary and diatom-bound δ15N data, which indicate greater nitrate consumption (François et al., 1997). Interestingly and as noted above, our model shows that nitrate is decoupled from phosphate in Southern Ocean surface waters. While phosphate concentration increases due to underutilization, nitrate concentration decreases, reflecting a globally higher denitrification rate and a declining global ocean inventory of fixed nitrogen. The nutrient decoupling may in fact suggest a possible reconciliation of the apparently contradictory proxy results regarding glacial Southern Ocean nutrient utilization.
Take-Home Messages
There are a few take-home messages. First, there are three important controls on global export C:N:P, namely, the physiological response to environmental changes, a shift in community composition, and the balance in regional production (Figure 4). Under global warming, the physiological response for all PFTs was production of more carbon-rich organic matter. Under glacial conditions, the physiological response was more mixed, with nutrient depletion raising the C:P uptake ratio for all PFTs, but cooling lowering the C:P ratio in two of three PFTs. The community composition under warming very modestly shifted in favor of cyanobacteria. The shift under glacial conditions favored eukaryotes. The balance in regional production under both climate conditions was driven substantially by sea ice. It shrunk under warming but expanded under glaciation. Surprisingly, both changes had the effect of raising the global mean export C:N:P ratio. Under warming, the increase in production and the depletion of nutrients in previously ice-covered waters increased the contribution of the elevated C:N:P ratio of the Southern Ocean to the global mean. Under glacial conditions, the contribution of the low Southern Ocean C:N:P ratio diminished, raising the global mean.
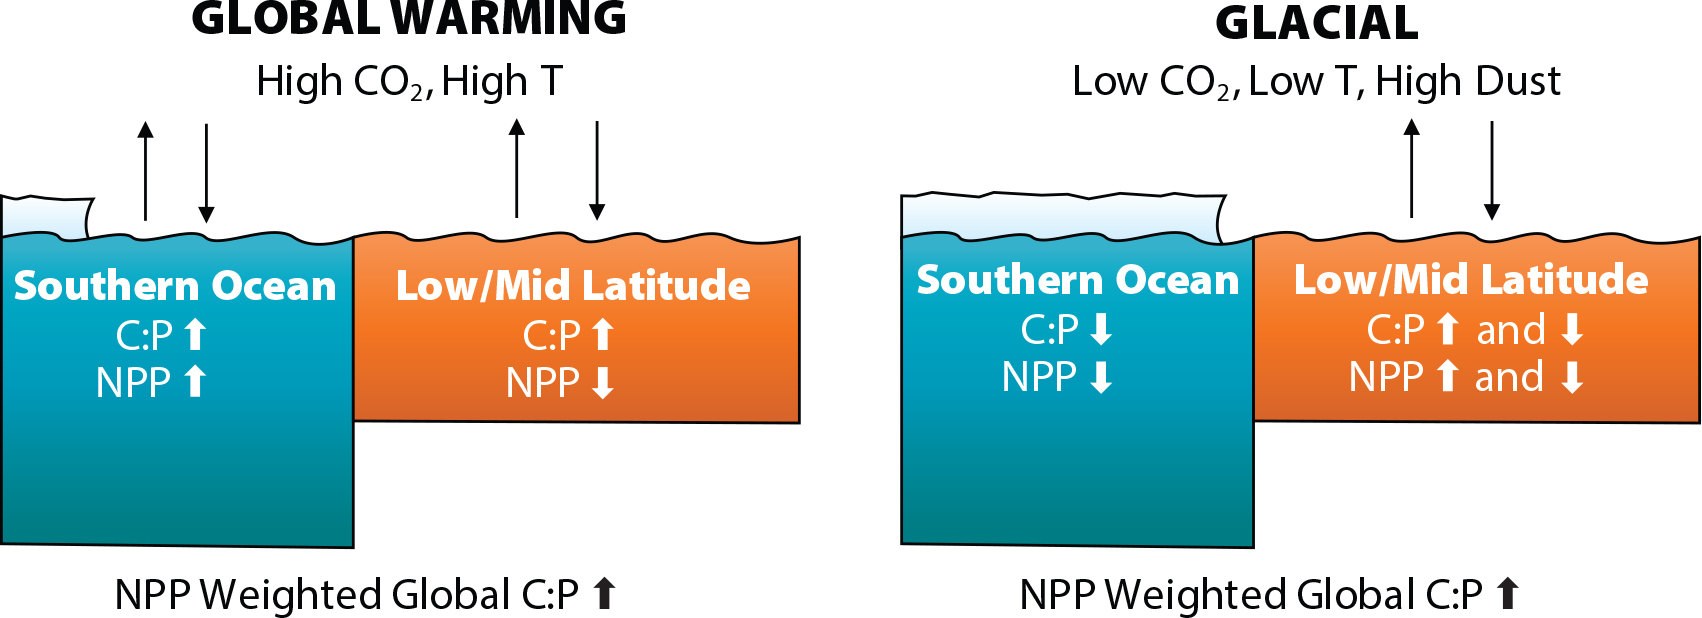
Figure 4. A schematic diagram illustrating the differences in two model conditions. In the global warming scenario (left), both C:P and net primary production (NPP) increase in the Southern Ocean as sea ice retreats and nutrient utilization increases. In the low/mid latitudes, C:P rises as nutrient availability decreases and temperatures rise. In the glacial scenario (right), both NPP and C:P in the Southern Ocean decrease as sea ice expands and nutrient utilization decreases. In the low/mid latitudes, the responses of C:P and NPP vary regionally. > High res figure
|
It is interesting to ponder whether this means the present state is at the lowest C:N:P ratio point in recent Earth history, so that going forward (warming) or backward (glaciation) would lead inevitably to a higher ratio, or whether this is an artifact of the model we used. We do not believe our results show a model artifact, because in different modeling studies, albeit limited in number, the C:P ratio also increased going forward (Kwiatkowski et al., 2018) and backward (Ödalen et al., 2020). Also, the changes in the C:N:P ratio simulated by our model can be understood reasonably in terms of predicted changes in phytoplankton physiology, taxonomy, and regional production. Furthermore, the elevation of the phytoplankton community C:P uptake ratio under glacial conditions (Figure 3d) is quite nuanced in space. It reflects, for example, a mixture of phosphorus depletion affecting eukaryotes by increasing their C:P uptake ratio and cooling affecting cyanobacteria by lowering their C:P uptake ratio (Figure 4). It seems possible that the balance of such tendencies can result in an overall lower global C:N:P ratio under some set of conditions. If so, it is not obvious that the present state is at the lowest C:N:P ratio point. It may be worth considering what conditions might actually lead to a lower C:N:P ratio compared to the present state. Based on the insights gained in this study, such conditions would include a nutrient replete surface ocean, cooling, lower light levels, and Antarctic sea ice retreat. At least one combination, global cooling plus sea ice retreat, does not seem probable. However, the bipolar seesaw observed between the two hemispheres suggests at least that Northern Hemisphere cooling could be accompanied by Southern Hemisphere warming (Crowley, 1992; Markle et al., 2016) and possibly sea ice retreat. On the other hand, if surface winds were to become substantially stronger, they would deepen the mixed layer and reduce the average light level for phytoplankton there. The same winds would also mix cool and nutrient-rich subsurface waters upward to the surface. These conditions if prevalent in large areas of the world ocean may lead to a lower global mean C:N:P ratio. Perhaps the question of whether the present state is at the lowest C:N:P ratio point or not can be recast in terms of how realistic such conditions are.
The second take-home message is that, given these results, it is important to have (at least) these three controls properly represented in global models with flexible stoichiometry. Thus, having multiple PFTs is essential to allow for shifts in phytoplankton community composition. Also, formulations of flexible phytoplankton C:N:P uptake ratio that account for a full set of environmental drivers like nutrients and temperature are important. Finally, models that cannot simulate dynamic shifts in regional production would be challenged in predicting the global export C:N:P ratio.
Third, the search for a more complete description of organic matter export C:N:P is an important ongoing goal in ocean biogeochemistry. For example, our model is still missing heterotrophic control on the stoichiometry of sinking POM, an idea that originally prompted Weyl to consider the effect of variable C:P on glacial atmospheric CO2. Preferential remineralization of N and P by heterotrophy acts not only on POM but on dissolved organic matter as well.
The final message is to point out that as yet there is no paleo proxy for phytoplankton stoichiometry, although coupling of multiple water column nutrient proxies, together with export proxies, may allow resolution of the resultant change in the water column ratio. Our results suggest that flexible C:N:P is important. It can possibly account for 20 µatm of atmospheric pCO2 change during a glacial period. Also, it strongly buffers carbon export against change under both warming and cooling. We could therefore hypothesize, perhaps provocatively, that the variability in the export C:N:P ratio under climate change will always act as a buffer against change in carbon export. If a new proxy for phytoplankton stoichiometry were developed, it could be used to test the hypothesis and open a new subfield of paleo research probing ecological change and driving mechanisms for atmospheric CO2.
Acknowledgments
This work was funded by the US National Science Foundation (OCE-1827948). KM was supported by the Leverhulme Trust Visiting Professorship at the University of Oxford. RR acknowledges support from ERC Consolidator Grant APPELS: ERC-2015-COG-681746 and a Wolfson Research Merit Award. Numerical modeling and analysis were carried out using resources at the University of Minnesota Supercomputing Institute. Guest editor P. Delaney asked probing questions that motivated us to think deeper about the lowest C:N:P point. All model results presented here are archived at the Biological & Chemical Oceanography Data Management Office and freely accessible (https://doi.org/10.26008/1912/bco-dmo.810368.1 for the global warming results and https://doi.org/10.26008/1912/bco-dmo.784634.1 for the glacial results).