Introduction
The program called Processes driving Exchange At Cape Hatteras (PEACH) uses observations and models to study exchanges of seawater and its constituents between the continental shelf and the open ocean near Cape Hatteras, North Carolina, through a US National Science Foundation-funded collaboration among principal investigators at the University North Carolina at Chapel Hill, Skidaway Institute of Oceanography (University of Georgia), Woods Hole Oceanographic Institution, North Carolina State University, and the Coastal Studies Institute at East Carolina University. Boundaries between subtropical and subpolar oceanic gyres are characterized by confluent western boundary currents in the open ocean and convergence in the adjacent shelf and slope waters. Strong forcing typical of midlatitude western ocean margins modulate the resulting net export of shelf waters and complex, bidirectional shelf-deep ocean exchanges. Exchanges between the shelf and the open ocean are central to global carbon budgets, marine ecosystem dynamics, larval and pollutant transports, and modulation of storm tracks and intensity, and thus have significant environmental, economic, and societal implications.
Recent examples of anomalous forcing along the US East Coast underscore the importance of understanding the dynamics that control exchange between the open ocean and the continental shelf at the confluence of the North Atlantic gyres near Cape Hatteras (Figure 1). Large deviations in Gulf Stream position relative to the typical meander envelope (Gawarkiewicz et al., 2012), extreme wintertime wind stress and buoyancy fluxes (K. Chen et al., 2014), accelerated shelf warming (Forsyth et al., 2015), and sea level rise north of Cape Hatteras (Sallenger et al., 2012; Andres et al., 2013) have been documented in recent years. Such trends are potential harbingers of larger shifts in atmospheric and oceanic forcing, yet their effects on shelf-open ocean exchange are not well understood. Developing better understanding and predictive capacity are central goals of PEACH. Early results, discussed below, both confirm expectations and provide surprises about the region’s physical oceanography. Beyond the Gulf Stream, a documentary film produced by Kyle Lawrence-Maddux based on PEACH cruise activities, was shown at the 2020 Woods Hole Film Festival and is available at https://vimeo.com/279906819.

FIGURE 1. (a) Schematic depiction of circulation in the Northwest Atlantic and (b) zoom in on the Cape Hatteras region. SAB = South Atlantic Bight. MAB = Mid-Atlantic Bight. Created by Anna Boyette, after Schmitz (1996) and Csanady and Hamilton (1988). > High res figure
|
Background
The most prominent feature of the mean circulation in the PEACH study area is the Gulf Stream (orange curve in Figure 1a), the subtropical western boundary current in the Northwest Atlantic. It carries components of both wind-driven and overturning circulation (Meinen et al., 2010; Buckley and Marshall, 2016), so its strength is coupled to both the deep-reaching thermohaline circulation and the surface-intensified flows driven by the basin-wide wind field. Largely unconstrained by topography, the Gulf Stream transitions from a shelf-adjacent boundary-trapped current along the South Atlantic Bight (SAB, which extends from Cape Canaveral to Cape Hatteras) to a separated jet northeast of Cape Hatteras. The Gulf Stream’s temporal and spatial changes in offshore position, flow orientation, and transport are discussed more fully below.
Counterclockwise mean circulation (black curves in Figure 1a) in the Slope Sea separates the Mid-Atlantic Bight (MAB shelf extends from Cape Hatteras to Cape Cod) from the mean path of the separated Gulf Stream, downstream of Cape Hatteras (Csanady and Hamilton, 1988). The Slope Sea is generally filled with cooler and fresher waters than are found in the Gulf Stream. The Deep Western Boundary Current (blue-gray path) flows equatorward through the study area, carrying components of the North Atlantic Deep Water at depths between 1,000 m and 3,000 m, as part of the deep limb of the Atlantic Meridional Overturning Circulation (Toole et al., 2017). It crosses underneath the Gulf Stream off Cape Hatteras, allowing for complicated interactions between the deep and upper components of North Atlantic circulation (Pickart and Smethie, 1993; Spall, 1996).
On the MAB shelf, the mean flow is equatorward (blue arrows in Figure 1a) from Georges Bank to Cape Hatteras, including flow over the continental shelf (Lentz, 2008) and in a narrow shelfbreak jet (purple in Figure 1a; Linder and Gawarkiewicz, 1998), each of which carries about 0.25 Sv (1 Sverdrup [Sv] = 106 m3 s–1; Linder and Gawarkiewicz, 1998; K. Chen and He, 2015). These waters originate as far north as the Labrador Sea (Chapman and Beardsley, 1989). Shoreward of the Gulf Stream, in the SAB south of Cape Hatteras, there is thought to be mean poleward flow (light green arrow in Figure 1a; Lee et al., 1991; Blanton et al., 2003), particularly off the northernmost part (Savidge and Bane, 2001; Savidge and Savidge, 2014). The adjacent Gulf Stream strongly influences SAB shelf circulation and hydrography, and with limited river discharge into the SAB, shelf water is difficult to distinguish from Gulf Stream waters based on temperature and salinity alone. However, striking differences between Gulf Stream and SAB biogeochemical properties can develop through bio-mediated episodic shelf processes with timescales that appear to align with shelf residence times (Menzel, 1993; Savidge and Savidge, 2014). In the immediate vicinity of Cape Hatteras, a multiyear mooring data set from the early 1990s illustrated persistent along-shelf convergence of MAB and SAB shelf waters at Cape Hatteras (Figure 2d) in both means and daily data (Savidge and Bane, 2001). The MAB and SAB salinity and temperature contrasts form the Hatteras Front (Figure 1b), whose along-shelf density gradient supports cross-shelf geostrophic flow within the Front (Savidge and Austin, 2007).
These circulation features affect the PEACH study region across a range of spatial and temporal scales. Of particular interest to PEACH are wave-like lateral meanders in the Gulf Stream’s path that form nearly continuously and propagate along the SAB, with largest amplitude downstream of the Charleston Bump (~31°N; Figure 2a). The crests and troughs of the meanders and their associated frontal eddies move downstream at speeds of 20–60 km day–1 with roughly weekly period (Bane and Dewar, 1988). Eddy decay regions off Georgia and approaching Cape Hatteras are associated with elongation of frontal features, offshore transport of momentum and heat, and onshore transport of nutrients (Lee et al., 1991). Measurements of currents along the SAB shelf adjacent to the Gulf Stream commonly exhibit three- to eight-day variability associated with the passage of meanders, highlighting the importance of accurately characterizing the Gulf Stream as the boundary condition to the shelf-focused PEACH program.

FIGURE 2. (a) Sea surface temperature (SST) image offshore of the South Atlantic Bight (SAB) with Gulf Stream meander crests (C) and troughs (T) labeled, and a white star marking the position of the Charleston Bump. MAB = Mid-Atlantic Bight. CCR = Cold Core Rings. Image from Rutgers University (b) SST image of the Gulf Stream and Slope Sea offshore of the Mid-Atlantic Bight shelf. Image from Rutgers University (c) Average shelfbreak temperature, salinity, density, and along-shelf velocity during PEACH measured along the cross-shelf section in Figure 3. After Todd (2020), Figure 7 (d) Mean flow convergence near Cape Hatteras. From Savidge and Bane (2001). > High res figure
|
Within the MAB, the shelfbreak front (SBF)—the water-mass boundary between the typically warmer Slope Sea and the typically cooler shelf waters (Figure 2b)—is a continuous feature from Georges Bank (~40°N) to Cape Hatteras (~35.5°N). Cooler, fresher MAB shelf waters are typically less dense than warmer, saltier waters in the Slope Sea, so the SBF is often associated with a surface-intensified equatorward shelfbreak jet (e.g., Linder and Gawarkiewicz, 1998). In the southern MAB during PEACH, cross-frontal temperature and salinity gradients were nearly compensated in their effect on density, thereby leading to weak vertical shear in the time-mean shelfbreak jet (Figure 2c). While the mean core speed of the shelfbreak jet is ~0.2 m s–1, it is present in only ~60% of repeated cross-shelf/slope velocity sections across the MAB off New Jersey (Forsyth et al., 2020). The subsurface MAB Cold Pool forms as cold, well-mixed wintertime shelf waters inshore of the SBF (e.g., Figure 2c) are capped by summertime heating and is typically the densest water on the MAB shelf (Houghton et al., 1982). Gawarkiewicz and Linder (2006) used near-surface drifter paths to show that the southern terminus of the SBF sometimes turns offshore well north of Cape Hatteras but at other times turns abruptly offshore near the Gulf Stream separation point at Cape Hatteras. Understanding the reason for this variable behavior of the SBF is one of the objectives for PEACH.
Hatteras Front variability is also of interest (Savidge and Austin, 2007). The density gradient across the front varies with season, and the resulting cross-shelf flow along it varies as well. Strong shoreward flow has been demonstrated in fall and winter; in late spring, evolving shelf water density contrasts can result in cessation or reversal of flow along the Hatteras Front (Savidge et al., 2013). Conversely, Churchill and Berger (1998) document seaward along-front flow in the portion of the Hatteras Front near the shelf edge, illustrating the complex and important role this feature may play in cross-shelf exchanges. Temporal variability in along-shelf transport is largely driven by the winds, so the Hatteras Front also moves in response to along-shelf winds, sometimes more than 100 km along the shelf. This motion carries the Front past significant alongshelf changes in bathymetry (narrowing, shoaling shelf approaching Hatteras from either north or south, abrupt changes in coastline and isobath orientation), which may also affect flow within the Front. The export examined by Churchill and Berger (1998) also depended on motion of the Front.
Finally, several factors make the PEACH study timely. The Cape Hatteras region is important as a potential carbon sequestration hotspot, because shelf waters are typically more productive than the open ocean waters (Wood et al., 1996). With along-shelf convergence driving net export from the shelf to the open ocean, there is opportunity to advect organic carbon off-shelf and sequester it in the open ocean. Additionally, there is increasing evidence that the Northwest Atlantic circulation system is particularly sensitive to climate change (e.g., Z. Chen et al., 2020). This motivates closer study in PEACH, as most of these circulation elements have connections to other parts of the globe, and variability in their properties could lead to changes in the interaction of these currents. Also, this region is the birthplace of many extratropical nor’easters that impact major population centers across the northeastern United States (Bane and Osgood, 1989), and it is the location where many tropical cyclones make landfall (Olabarrieta et al., 2012; Zambon et al., 2014). These atmospheric events critically depend upon the fluxes of heat and moisture from the ocean to the atmosphere, which can vary greatly across sea surface temperature (SST) fronts.
PEACH Objectives
This dynamic setting motivates the scientific questions and objectives for PEACH. First, recognizing the Gulf Stream influence on the shelf systems: How does the Gulf Stream influence the latitude of detachment of the shelfbreak jet? How does the Gulf Stream influence the position and properties of the Hatteras Front on the shelf? What dynamics control the convergence of MAB and SAB shelf waters and its correlation to Gulf Stream variability?
Second, noting that the shelf narrows and shoals approaching Cape Hatteras from either north or south: Does the wind-driven along-shelf transport drive cross-shelf exchange as the flow traverses the changing along-shelf bathymetry? Does the flow interaction with topography help drive export as the water is forced through a constriction just offshore of Cape Hatteras?
Finally, how do evolving density contrasts between water masses affect exchange seasonally and potentially climatically?
The PEACH Field Campaign
The PEACH field campaign included a variety of fixed and mobile platforms, shore-based remote sensing, and shipboard sampling (Figure 3). Fixed platforms included moorings and surface buoys organized along three isobaths: shelf moorings along the 30 m isobath (purple triangles and diamonds), upper slope moorings along the 100 m isobath in the MAB and along the 250 m isobath in the SAB (purple triangles), and bottom-mounted current- and pressure-sensor equipped inverted echosounders (CPIES) along the 1,100 m isobath and spanning the Gulf Stream, just downstream of Cape Hatteras (purple circles). Coastal high-frequency radar installations (yellow and blue triangles; hatching shows the nominal areal coverage) provided maps of surface currents up to 200 km offshore. Autonomous underwater gliders measured water column properties along and across the southern MAB shelf break (blue line) and on the MAB and SAB shelves (red lines). These assets were used to capture a broad range of temporal and spatial scales of variability in this region of large episodic export and exchange.

FIGURE 3. Processes driving Exchange At Cape Hatteras (PEACH) observational program asset map showing fixed platforms (solid symbols), mobile assets (solid lines), and high-frequency radar coverage (the larger hatched areas for CODAR [Coastal Ocean Dynamics Applications Radar] systems, and the smaller hatched area for WERA [WavE Radar] systems. Dashed lines mark satellite altimeter paths. The larger purple triangle marks the Ocean Energy mooring. CPIES = Bottom-mounted current- and pressure-sensor equipped inverted echosounders. ADCP = Acoustic Doppler current profiler. CTD = Conductivity-temperature-depth instrument. NDBC = National Data Buoy Center. > High res figure
|
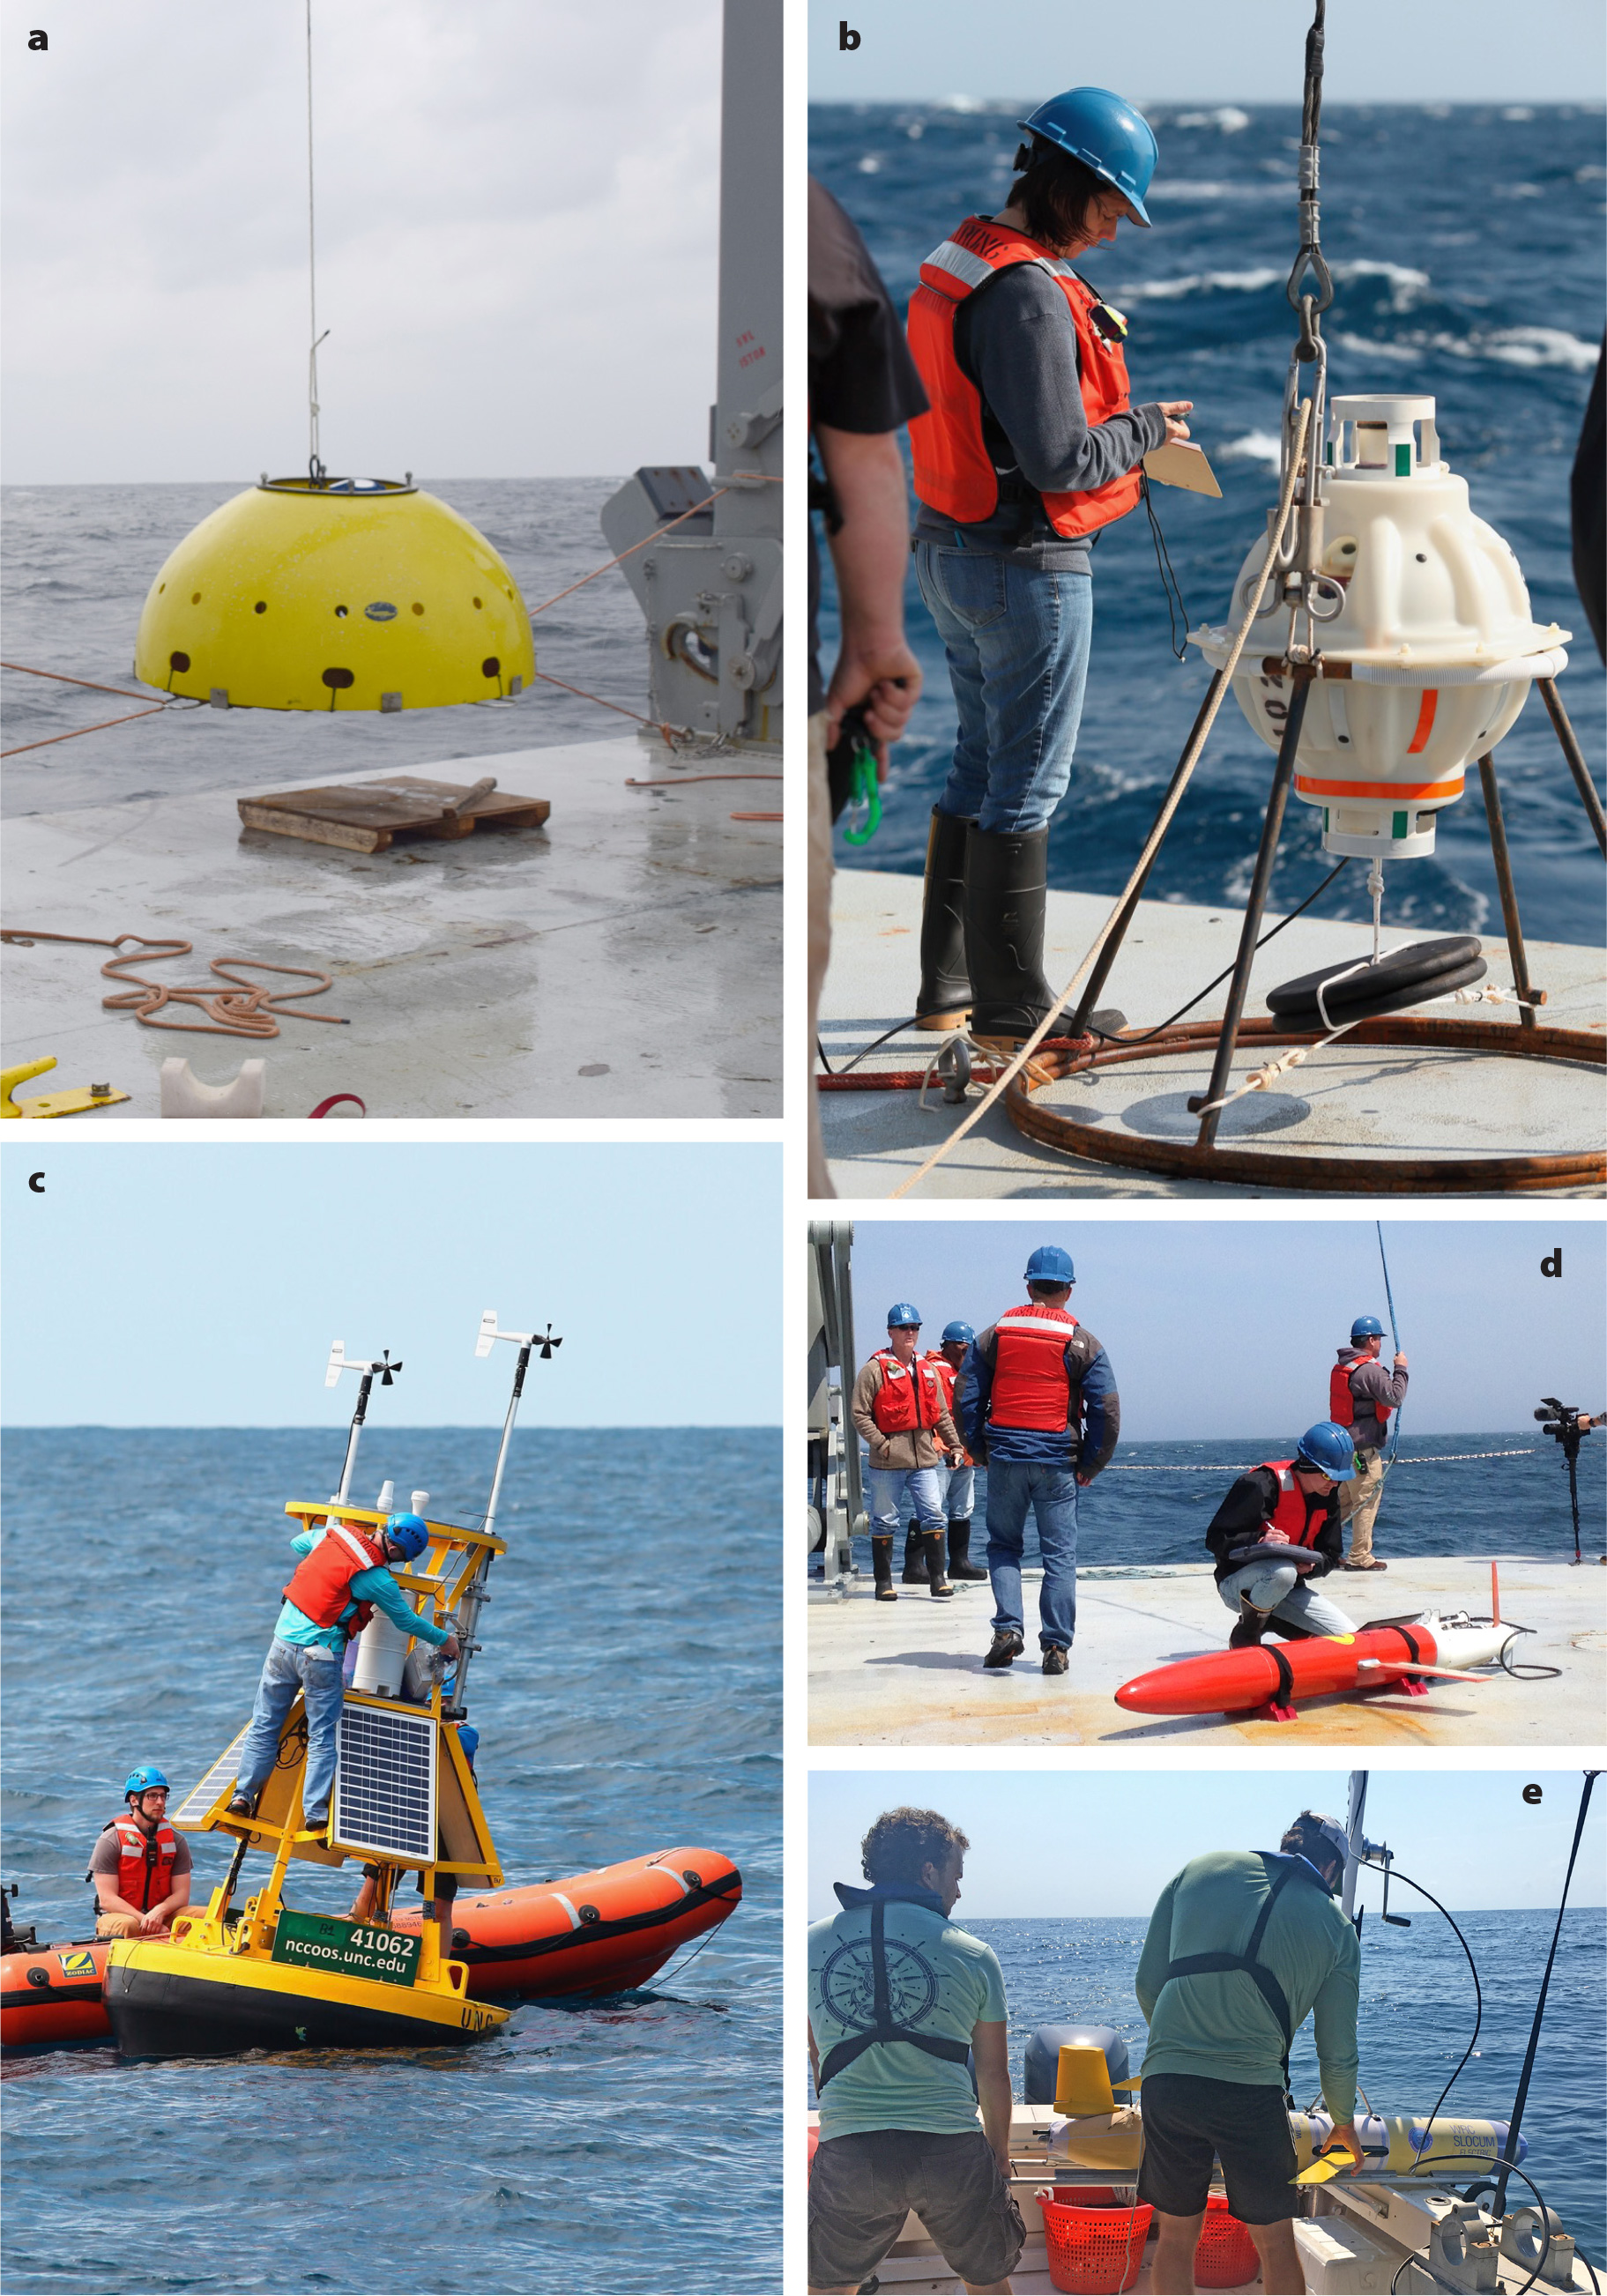
Near-bottom moorings included acoustic Doppler current profilers (ADCPs), which measure current profiles from the bottom to near the surface, and CTDs to monitor bottom water properties. These were contained in trawl-resistant domes along the shelf break (e.g., Figure S1a in the online supplementary materials), and smaller open frames were used along the 30 m isobath. The Ocean Energy site along the shelf break has been routinely occupied since 2014 as part of the North Carolina Renewable Ocean Energy Program (NCROEP). CPIES (Figure S1b) are acoustic devices that are moored in deep water underneath major current systems to provide hourly estimates of vertical profiles of temperature and salinity (Andres, 2021) and directly measure of bottom pressure and near-bottom currents. Two meteorological buoys (Figure S1c) were installed on the shelf north and south of Cape Hatteras (purple diamonds in Figure 3) and had CTDs at multiple depths to give full water column coverage at those locations; long-term measurements at two National Data Buoy Center (NDBC) sites provided additional meteorological and near-surface measurements in the region (purple squares in Figure 3).
Two varieties of autonomous underwater gliders were used during PEACH (Figure 3). Spray gliders (Figure S1d; Sherman et al., 2001) sampled along the upper continental slope between the Gulf Stream (~35.5°N) and approximately 37°N and across the shelfbreak front near 37°N from April 2017 through May 2019 (blue line in Figure 3; Todd, 2020), returning 180 transects of temperature, salinity, density, absolute horizontal velocity, chlorophyll fluorescence, and 1 MHz acoustic backscatter in the upper ocean. Slocum gliders (Figure S1e; Schofield et al., 2007) measured temperature, salinity, pressure, chlorophyll, and colored dissolved organic matter fluorescence, optical backscatter, and dissolved oxygen over the continental shelf north and south of Diamond Shoals during 12 missions totaling 160 days at sea. Strong and variable currents over the shallow continental shelf prevented shelf gliders from routinely repeating predefined transects.
Two types of coastal-based high-frequency surface current radars were used. Three CODAR (Coastal Ocean Dynamics Applications Radar) systems (Barrick et al., 1977) mapped surface currents up to 200 km offshore, with resolutions of ~6 km and 1 hour. CODAR measurements were combined with those from four WERA (WavE RAdar) systems (Gurgel et al., 1999) to form composite surface current fields covering the shelf, slope, Gulf Stream, and beyond at the same resolution that the CODAR systems provided. WERA resolution itself is ~1 km and 20 minutes for the frequency of units deployed during PEACH, resulting in detailed surface current structure over much of the shelf and shelf edge, in addition to the composite maps of the entire study area.
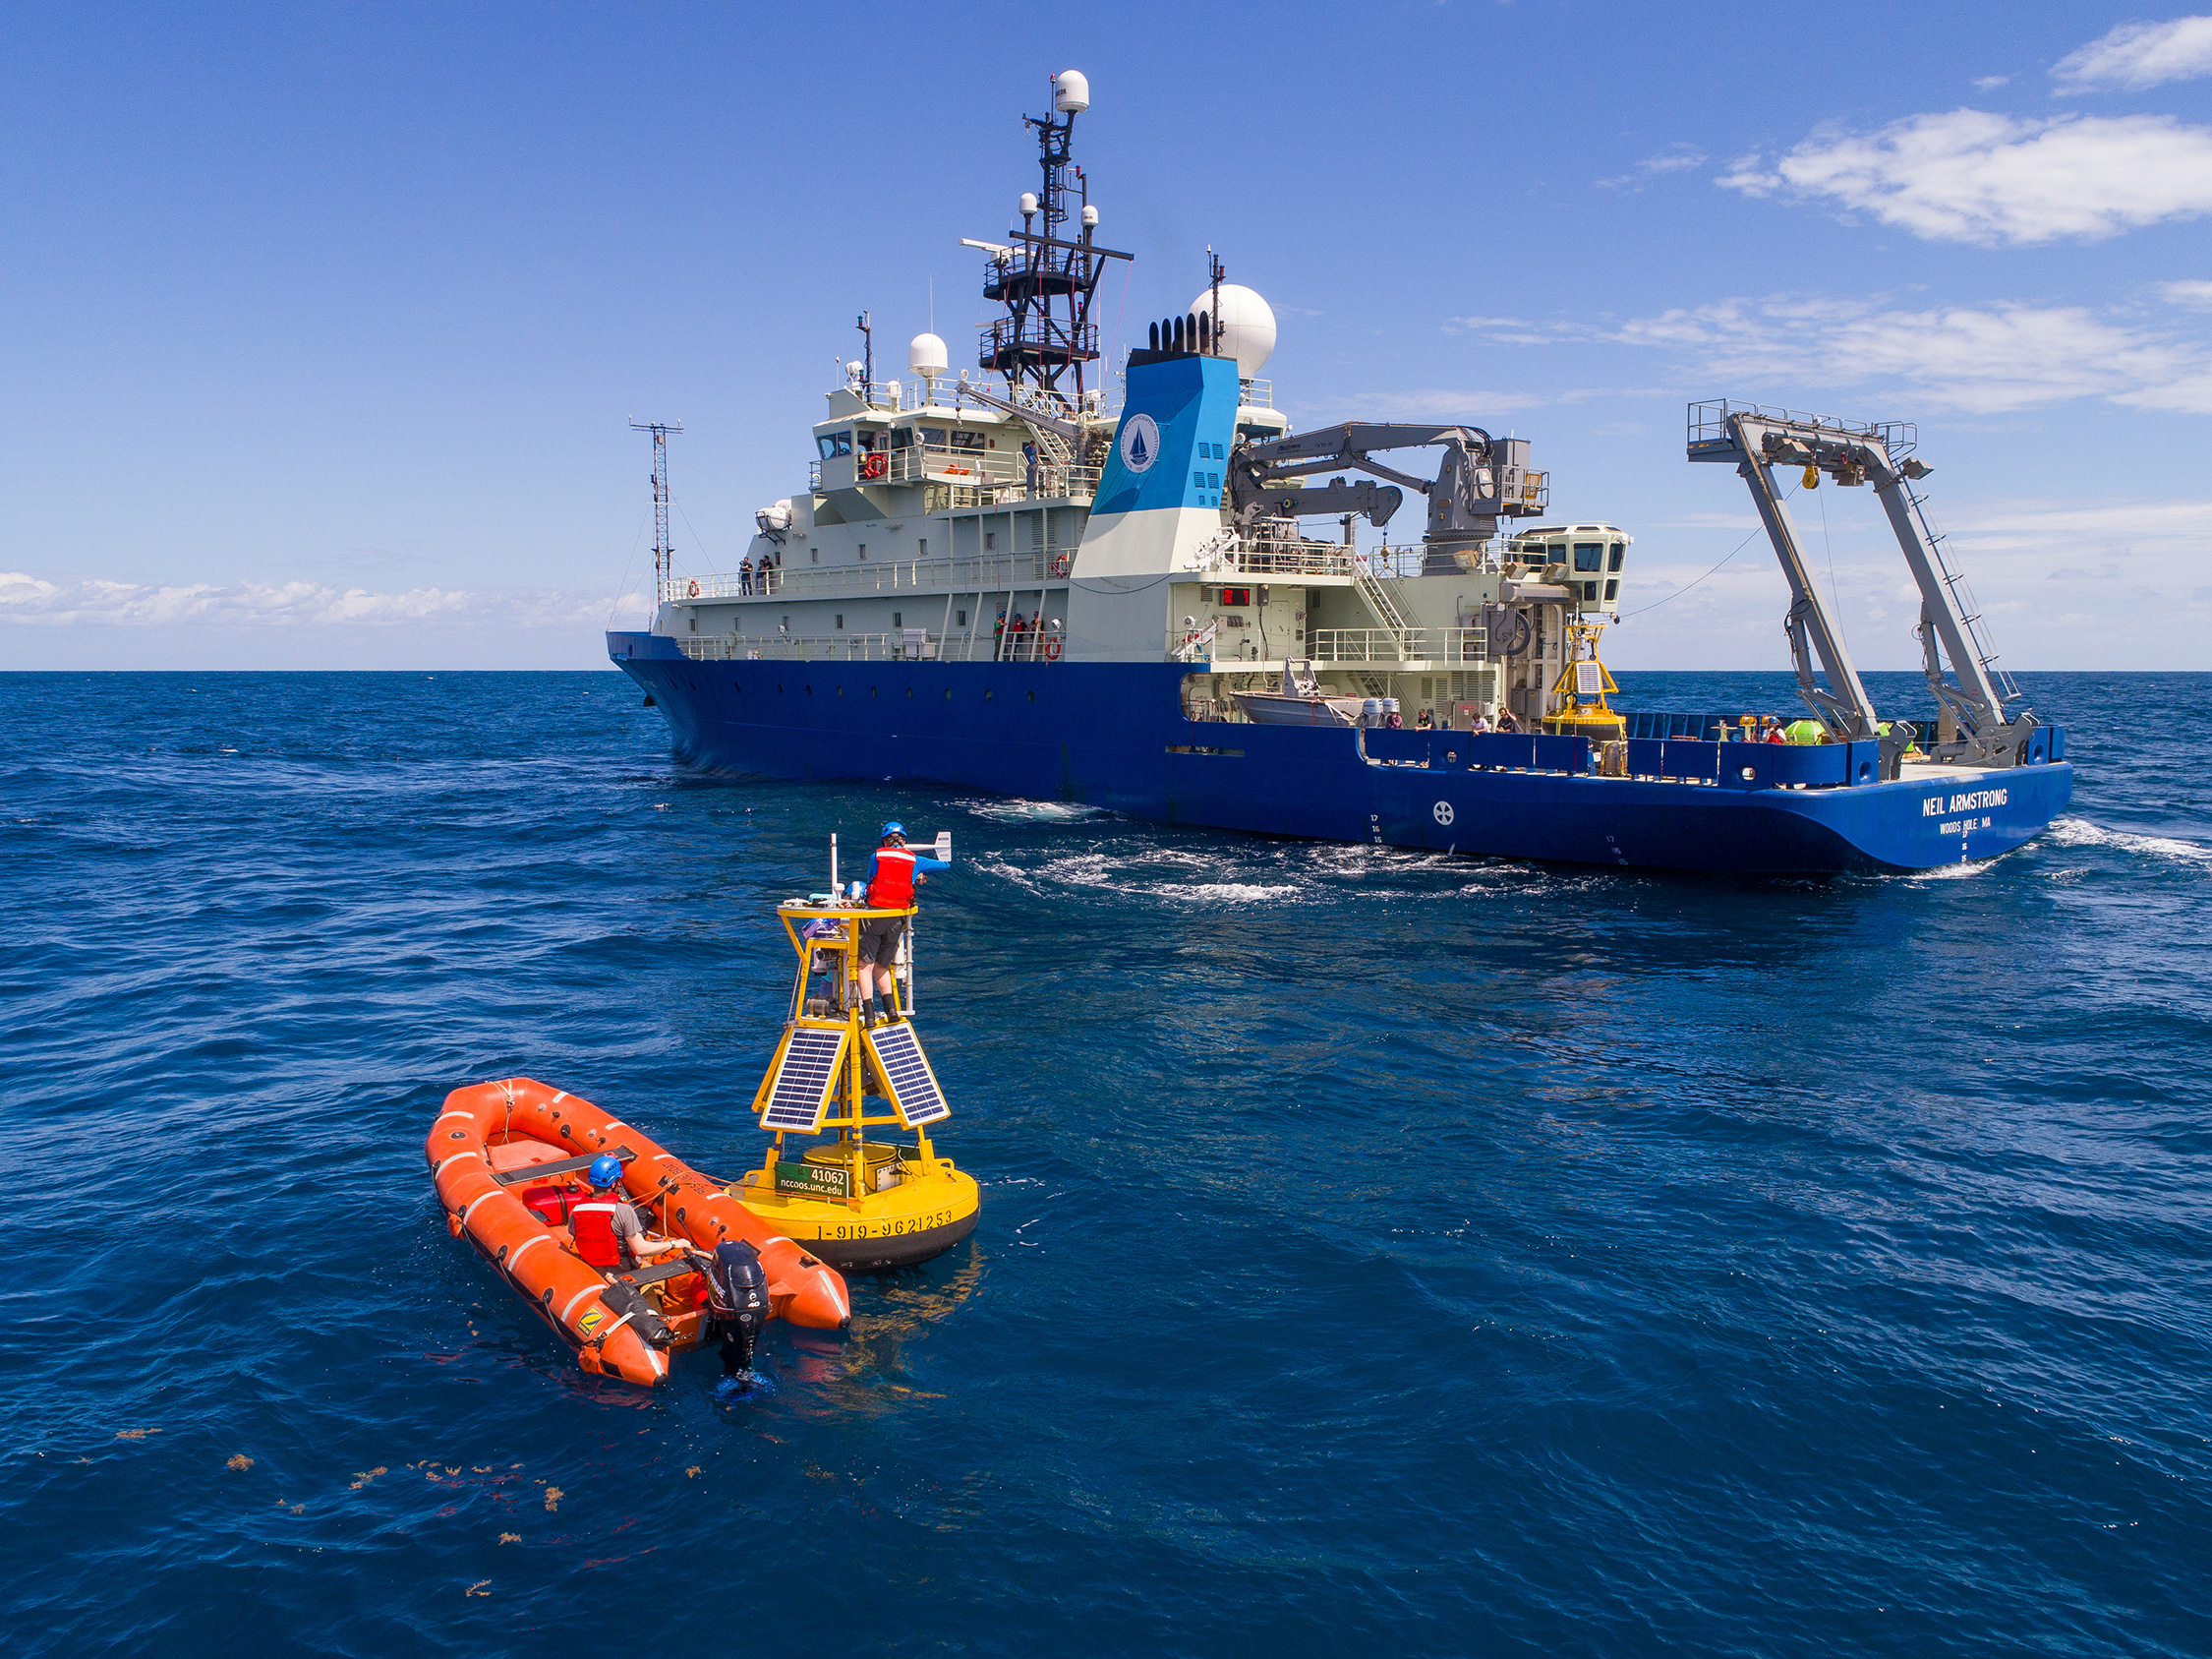
Three cruises were made aboard R/V Neil Armstrong to the study area. The first (AR15 in April 2017) deployed the mooring array and collected nearly 100 CTD profiles in water depths from 17 m to 3,000 m. A turnaround cruise in January 2018 (AR26) collected about 80 CTD profiles and included the first diving operations ever conducted off Armstrong. Nine rawindsondes were deployed as part of air-sea interaction studies, another first for Armstrong. A mooring added to the array during this cruise sampled the water column on the continental slope northeast of Hatteras with the first operational deployment of an articulating profiler (Thwaites et al., 2019; Figure 3). The third cruise (AR33) recovered PEACH moored instrumentation in November 2018 and collected 33 CTD profiles. The high wind record for the vessel, 77 knots at one point, was set on that cruise. Additionally, direct covariance flux measurement instrumentation (Edson et al., 1998) was installed on the forward mast to collect continuous measurements of air-sea momentum and buoyancy exchange rates. We also conducted a two-day focused study on air-sea interactions during a frontal passage. Eleven rawindsonde launches with complementary CTD/XBT casts sampled properties in both the upper ocean and the lower atmosphere. Unrelated to PEACH, a total of 11 Argo floats were deployed during the three cruises, with launches spread across the Gulf Stream so they would quickly disperse into the North Atlantic.
PEACH Modeling Component
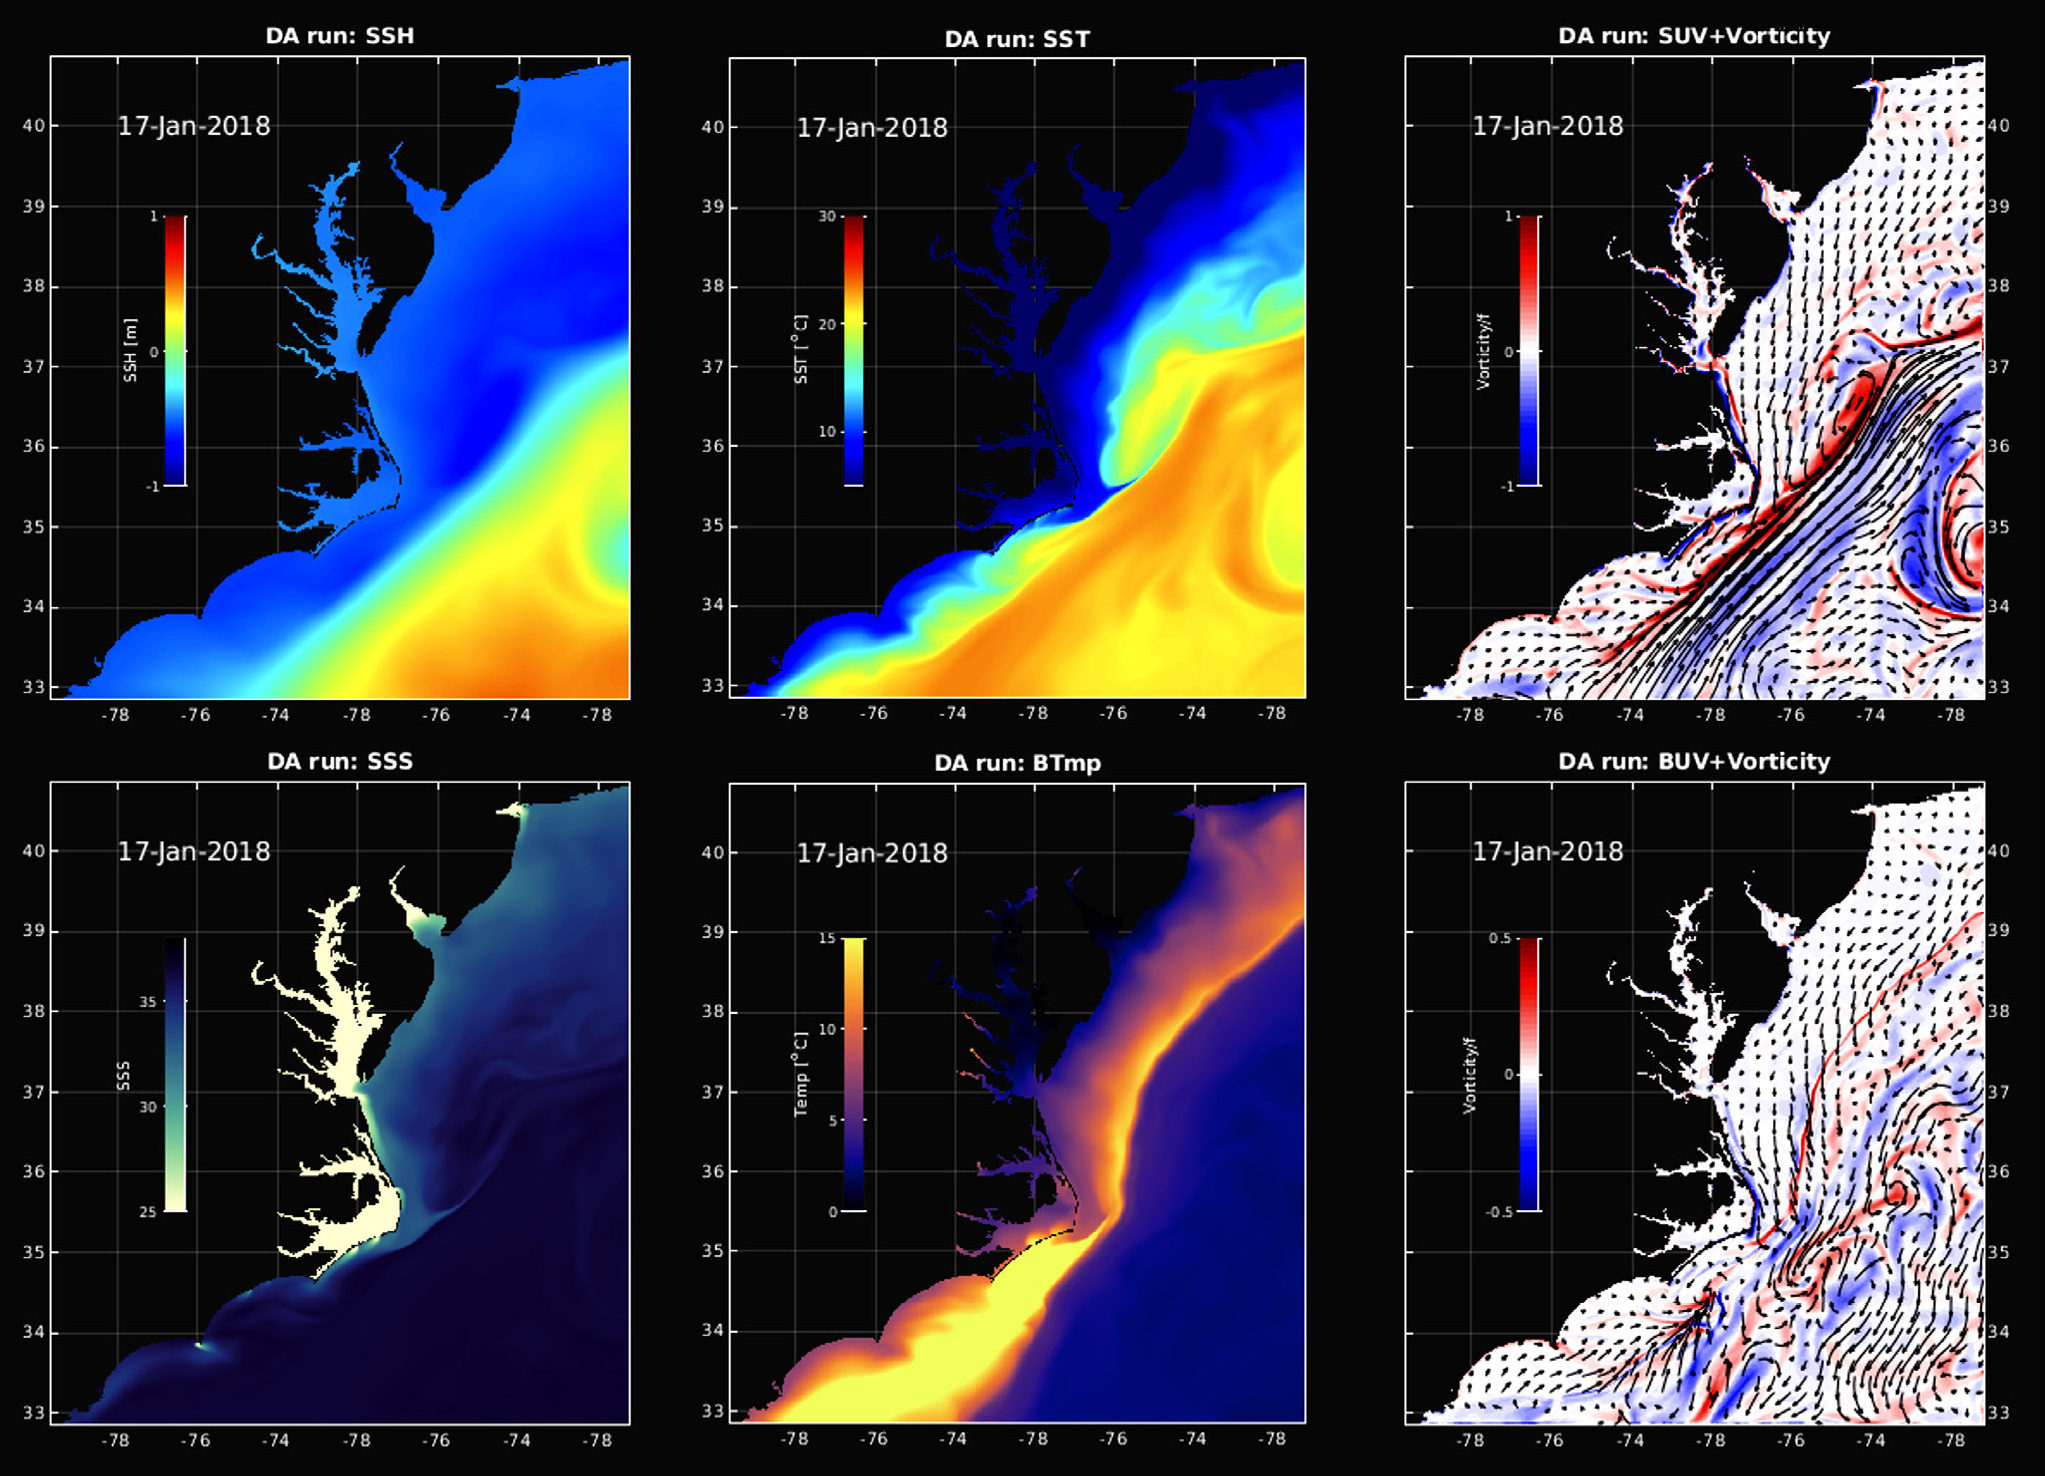
The numerical modeling effort of the PEACH program is built upon two realistic Regional Ocean Modeling System (ROMS; Shchepetkin and McWilliams, 2005) implementations. The first covers the entire US Atlantic coast with 7 km horizontal resolution and 36 vertical layers and focuses on large-scale Gulf Stream dynamics; the second covers the PEACH study area with 800 m horizontal resolution and 50 vertical layers to resolve both mesoscale and submesoscale circulation, enabling detailed comparisons with PEACH observations. Both model setups are nested inside the global data assimilative Hybrid Coordinate Ocean Model (HYCOM) Navy Coupled Ocean Data Assimilation (NCODA) analysis, superimposed with eight major tidal harmonics taken from the Advanced Circulation Model (ADCIRC) western Atlantic tidal database. Surface forcing conditions are obtained from the European Center for Medium Range Weather Forecast (ECMWF) reanalysis product and daily runoff data from USGS river gauges and National Water Model analyses. Both models are equipped with advanced data assimilation capability. The large-scale 7 km model applies ROMS’s 4-Dimensional Variation Data Assimilation (4D-Var) system (Moore et al., 2011), and the small-scale 800 m PEACH model applies the ensemble data assimilation approach. Both data assimilation model implementations reproduced the observed ocean states reasonably well during the PEACH field campaign period (2017–2018). We found that observations with broader spatial footprints (i.e., satellite-observed sea surface temperature and sea surface height, and hydrographic measurements from ships, gliders, and Argo floats) are very useful in constraining data assimilation model performance to resolve the multiscale, spatiotemporally complex circulation dynamics in the area. Fixed location measurements from moorings, CPIES, and NDBC buoys provide independent data sets for model validations. Model outputs are further used to examine the coastal ocean response to storms (Zambon et al., 2021), the Gulf Stream, variability and energetics, cross-shelf exchanges of heat and salt, and three-dimensional transport pathways (example output is presented in Figure S2). Important circulation features off Cape Hatteras (e.g., river plume dynamics, Hatteras Front T/S/density gradients, and along-front currents) are also diagnosed with model reanalyses. Additional modeling investigations will employ sensitivity experiments to isolate specific forcing processes (e.g., winds, Gulf Stream, variability, river flow) and to quantify their relative importance in determining the complex, non-equilibrium response of the coastal circulation.
Observations and Preliminary Results
Meteorologically, two “seasons” characterize wind and ocean-atmosphere flux regimes in the PEACH study area, similar to those defined by Davis et al. (1997). During the warm season (May to mid-September), mild persistent northeasterly winds (Figure 4a) are punctuated by the occasional passage of a tropical storm/hurricane. Time series of warm-season wind stress and ocean-atmosphere net heat flux (QNET) show low wind stress (~0.1 N m–2) and low QNET (~100 W m–2) predominantly into the ocean, dominated by solar shortwave radiative flux, and thus warming of the ocean throughout this season (Figure 4b). Fluctuations due to tropical storms Chris (early July) and Florence (mid-September) in 2018 are apparent (Zambon et al., 2021).
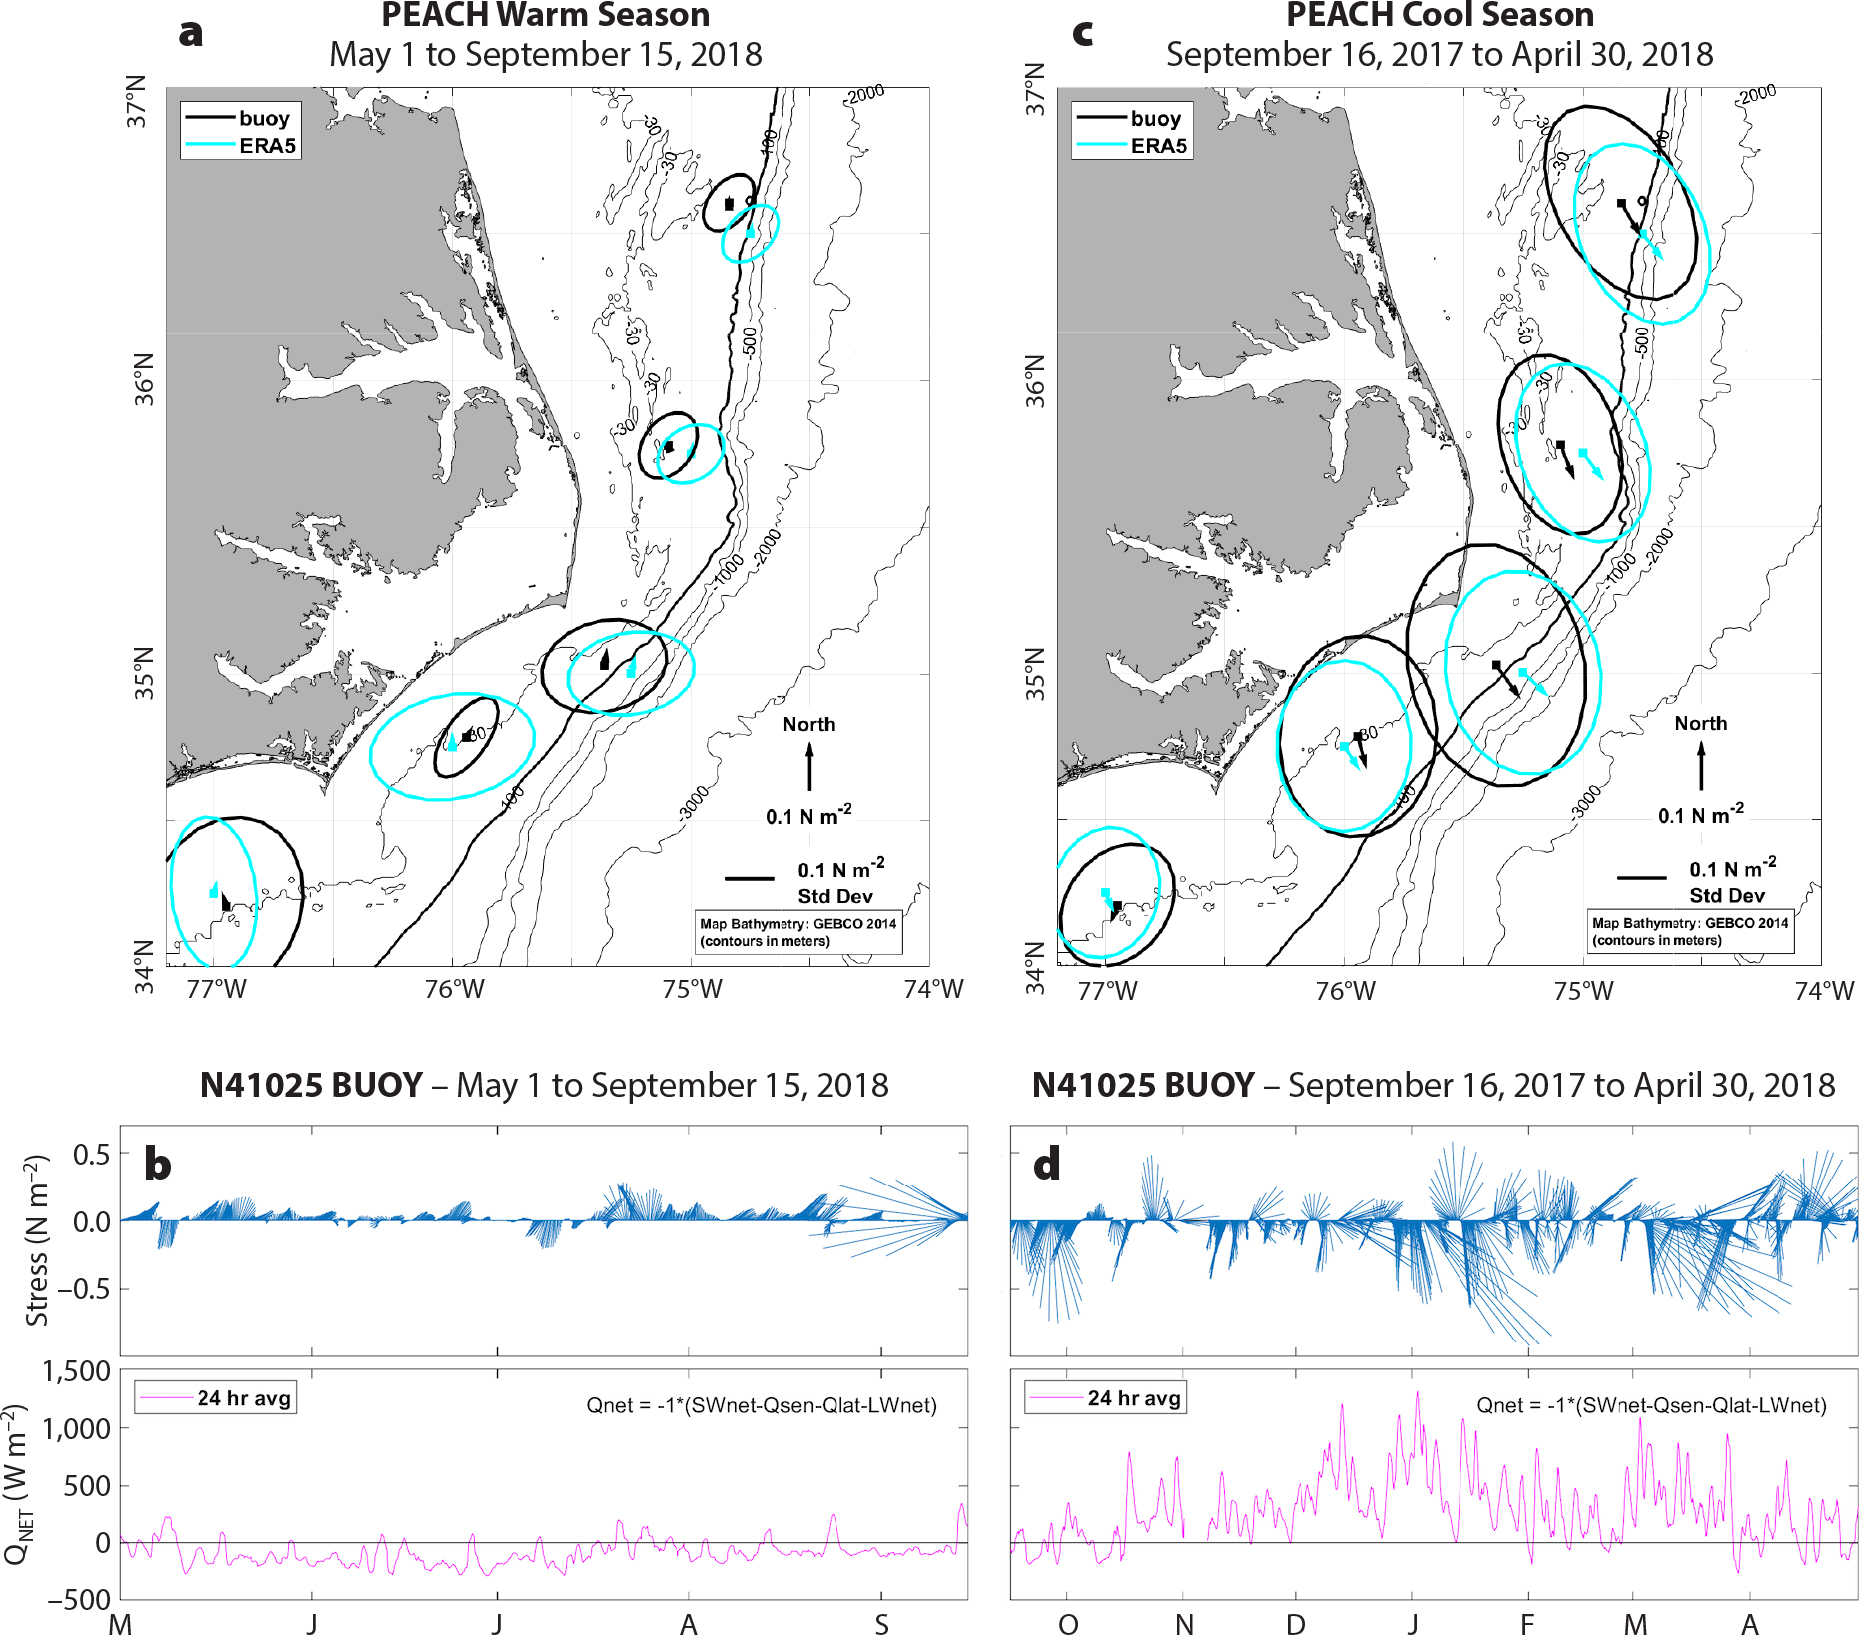
FIGURE 4. Mean wind stress and standard deviation ellipses from National Data Buoy Center (NDBC) and PEACH buoy meteorological observations during (a) warm season, and (c) cool season. Wind stress and net heat flux time history at NDBC buoy 40125 during 2018 (b) warm season, and (d) cool season. > High res figure
|
During the contrasting cool season (mid-September through April), mean northerly and northwesterly winds blow (Figure 4b). Cool season mean wind stress values and stress standard deviation ellipses are both much greater than during the warm season, with large temporal variations in stress and QNET owing almost entirely to extratropical cyclones transiting the area. QNET is large and out of the ocean, which makes the PEACH study area of great interest for air-sea interactions. The tremendous amount of energy transferred from the ocean into the atmosphere here can energize extratropical cyclones and occasionally leads to bomb cyclones (Dirks et al., 1988). A clear example was bomb cyclone Grayson in early January 2018, which created the largest hourly wind stress measured during the PEACH field program. This storm intensified very rapidly, with central pressure decreasing by 59 mb in 24 hours.
Following Grayson’s passage, the January 2018 PEACH cruise featured an examination of air-sea fluxes along Gulf Stream transects throughout the study region. Nine rawindsonde deployments measured atmospheric temperature, humidity, wind, and geopotential height, while simultaneous transects of ocean temperature were measured with XBTs and CTDs. The synoptic environment was characterized as an outbreak of continental cold air over the study region, so the experimental design followed those in the Genesis of Atlantic Lows Experiment (GALE) of 1986 (Bane and Osgood, 1989). The air-sea surface temperature difference during the inbound (offshore to onshore) transect exceeded 10°C, with calculated ~600 W m–2 latent and ~300 W m–2 sensible heat fluxes. During the November 2018 cruise, eddy covariance air-sea flux measurements were added for comparison to bulk flux estimates (e.g., Fairall et al., 2003), and rawindsondes were deployed at approximately 25 km intervals while in transit and at three-hour intervals while on station. A severe squall with surface winds in excess of 30 m s–1 was recorded for the final pre-frontal balloon launch on station inshore, followed later by veering winds indicating the frontal passage.
Five named tropical cyclones—Jose, Maria, Chris, Florence, and Michael—impacted the study area during PEACH. Interestingly, the magnitude of the wind stress associated with extratropical and tropical cyclones were comparable, with bomb cyclone Grayson and a series of storms during March of 2018 being prominent (Figure 5a,b). A shallow mixed layer in the region was a primary factor in the rapid weakening of Hurricane Florence prior to landfall, in addition to a several-day stall over the Carolinas, which led to tremendous amounts of rain and flooding (Stewart and Berg, 2019; Zambon et al., 2021).
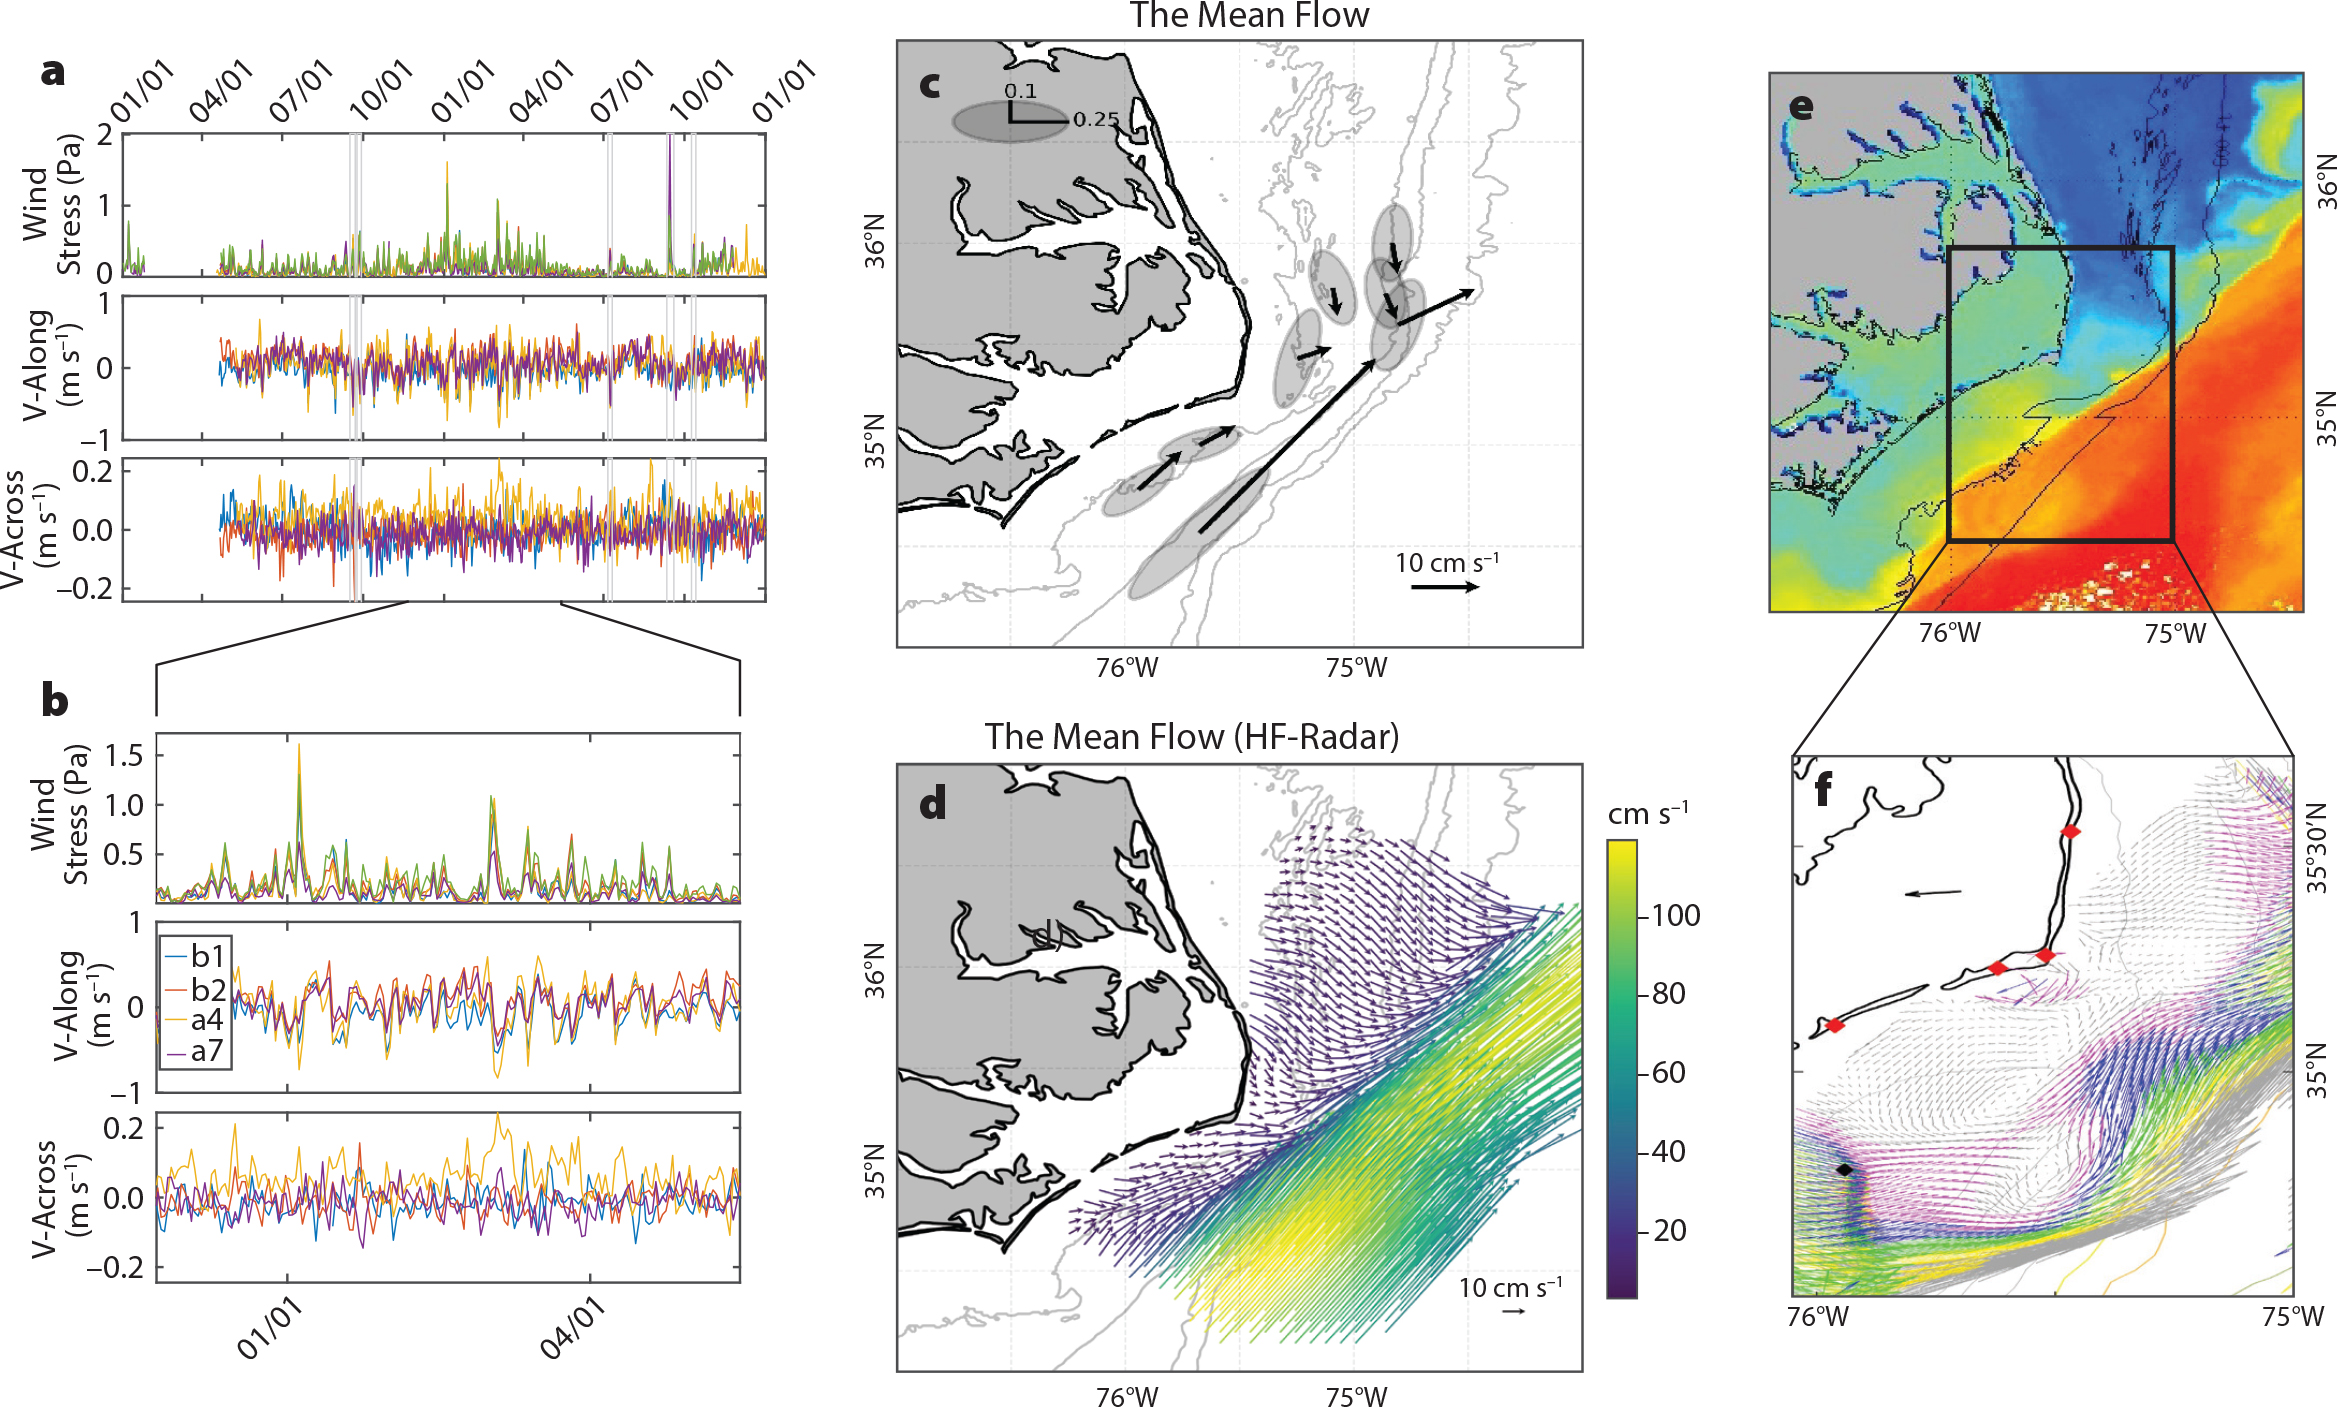
FIGURE 5. (a) Time series of wind stress magnitudes and along-shelf and cross-shelf currents on the 30 m isobath. Gray lines mark passages of named tropical storms. (b) Zoom in on winter 2018. (c) Mean current and standard deviation ellipses from the PEACH ADCP moorings; scales in m s–1. (d) Mean surface currents from combined high-frequency radars. (e) Sea surface temperature, with black box showing coverage of (f) WERA surface currents during April 22, 2018, depicting a frontal eddy. > High res figure
|
Daily and depth-averaged along-shelf currents from the four moorings along the 30 m isobath are visually correlated with the wind stress, which can drive very strong along-shelf flows. Daily and depth-averaged cross-shore flows often reached 0.05–0.1 m s–1; they were smaller than the along-shelf flows, but still large compared to many coastal environments, where they would typically be no more than 0.01–0.02 m s–1 (e.g., Lentz, 2008). Observed cross-shelf flows can be oriented either shoreward or seaward. Along-shelf currents were correlated with wind and were coherent over 100+ km along-shelf scales, consistent with prior work (Savidge and Bane, 2001). Cross-shelf currents are not coherent over such large scales, nor correlated with the wind, indicating that across-shelf processes are operating on a finer spatial scale than along-shelf processes (see Todd, 2020, for descriptions of episodic export events).
The mean depth-averaged currents over the 18-month deployment period (Figure 5c) show equatorward flow at the three northern moorings and poleward flow at the three southern moorings, with offshore flow at the two moorings in the middle. This depiction is very similar to the strong along-shelf convergence observed by Savidge and Bane (2001). Despite the 25 years separating that data set and the PEACH field program, there is an almost identical mean circulation field, suggesting that this aspect of the circulation is quite robust. Standard deviation ellipses everywhere parallel isobaths.
Earlier work also examined the influence of Gulf Stream variability on shelf circulation (Savidge and Bane, 2001). In this location, cloud cover frequently eliminates satellite SST as a useful measure of the Gulf Stream. Instead, Gulf Stream variability was determined from tall mooring blowdown at discrete locations within the Gulf Stream cyclonic flank. It was found to be uncorrelated with along-shelf velocities on the shelf, but highly correlated with along-shelf convergence. PEACH collected more detailed information on Gulf Stream spatial and temporal variation using two technologies: (1) bottom-mounted CPIES situated beneath the Gulf Stream along its path both up- and downstream from separation at Cape Hatteras, and (2) CODAR and WERA surface current radars, which provided a more complete characterization of Gulf Stream variability and effects on shelf circulation than previously possible. Eulerian mean surface current data from the combined CODAR/WERA radar returns show the Gulf Stream directly abutting the shelf break, with the 0.5 m s–1 contour roughly atop the 100 m isobath (Figure 5d). Peak mean speeds are 1.15 m s–1, and the jet axis direction rotates from 40°T to 50°T (°T = degrees true) after passing a line that extends southeastward from Diamond Shoals. The width of the Gulf Stream is about 55 km between the 1 m s–1 contours and 90 km between the 0.7 m s–1 contours. The jet axis was typically about 33 km from the onshore 0.7 m s–1 isotach.
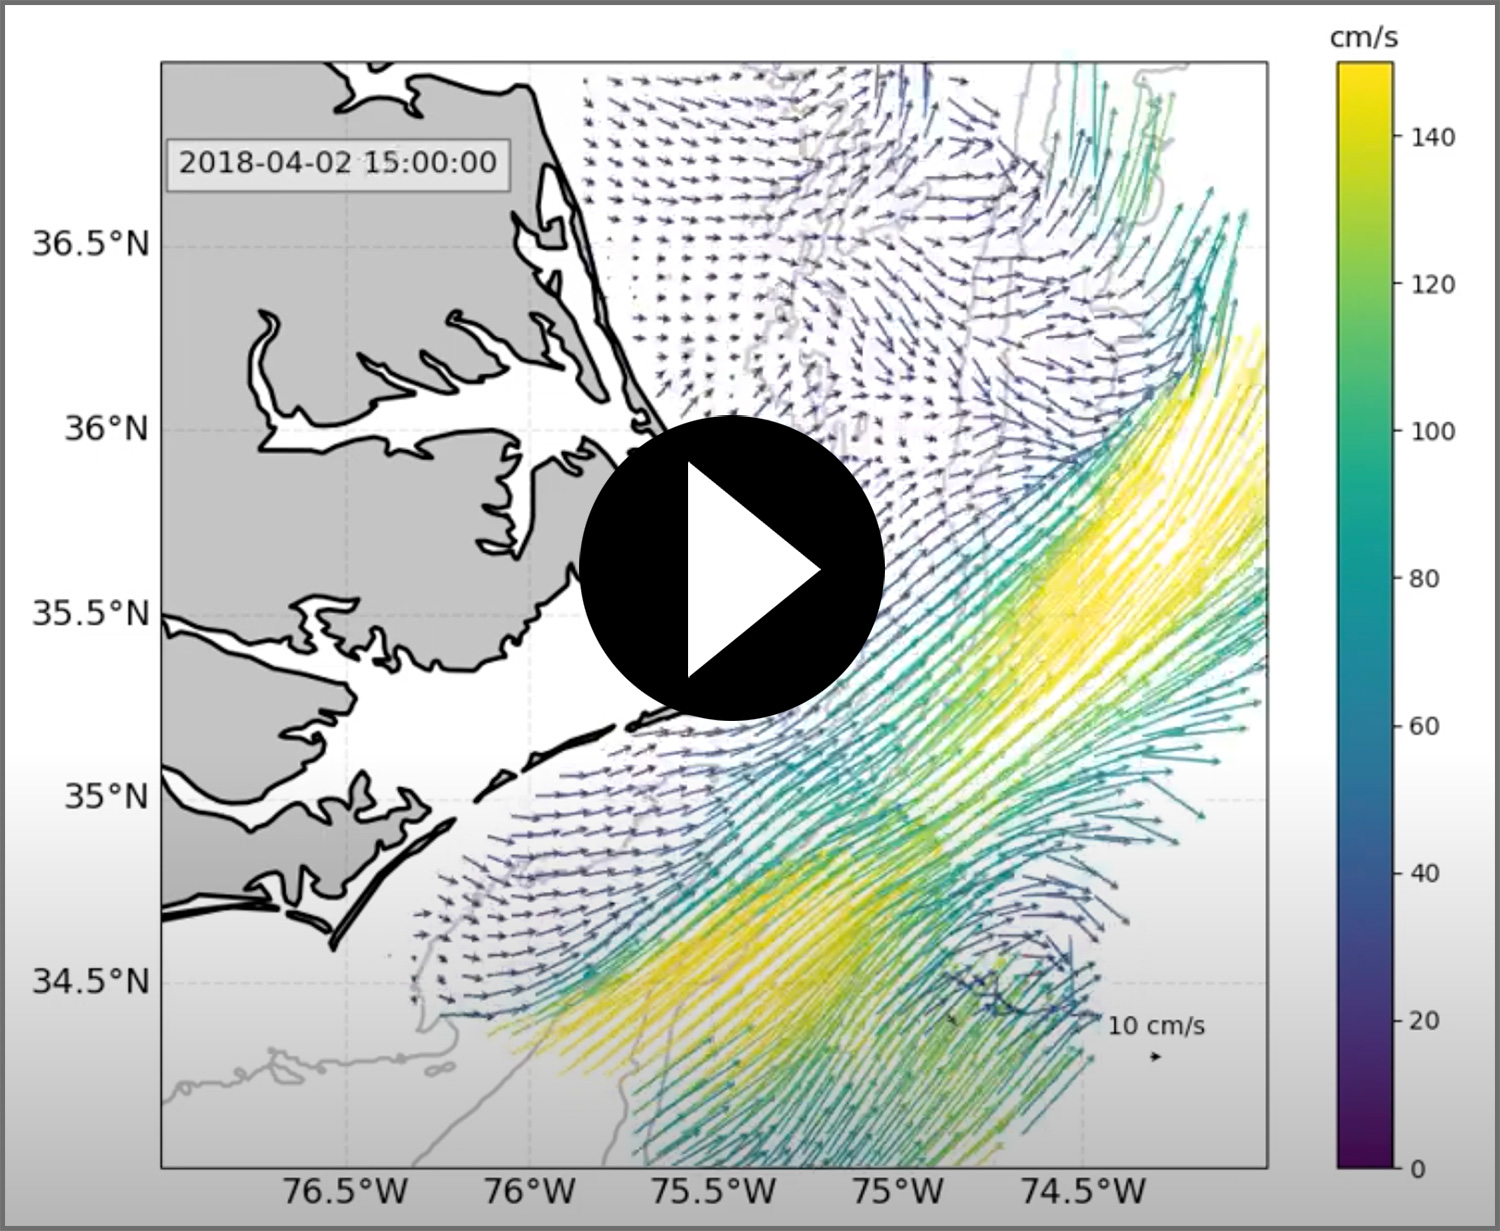
The time-varying surface currents were remarkably rich, as can be seen in a month-long animation from April 2018 that illustrates the current field measured by the combined radars every three hours (see online supplementary animation); it shows the Gulf Stream shifting position and frontal eddies propagating poleward along its inshore edge. We also note variability in shelf currents, which strengthen during strong wind stress events. Simple metrics from this time history of maps are being developed for comparison with the mooring data.
The higher frequency/finer resolution surface currents from WERA radar alone are demonstrated in a snapshot of the velocity field (Figure 5f) that also shows the field’s more limited spatial extent relative to the combined product. In this case, we are able to correlate a fine-scale circulation feature, shown in Figure 5e with a contemporaneous SST image of a frontal eddy on the inshore side of the Gulf Stream. We believe these types of processes promote exchange of shelf and Gulf Stream waters at meander timescales.
CPIES under the shoreward flank of the Gulf Stream provide rich information about variability in offshore Gulf Stream position and its vertical structure. Using independent observations of the vertical structure of the mass field, the travel time is converted into profiles of temperature, salinity, and density in Figure 6a (Andres, 2021). High-frequency fluctuations result from the passage of Gulf Stream meanders with three- to eight-day periods. Andres (2021) examined those frequencies and established the propagation properties of the meanders using spectral analysis of station pairs. The meanders produce onshore and offshore oscillations of Gulf Stream position, and these records produce estimates of the sizes of those oscillations (i.e., meander amplitudes) and how they vary over time and with along-stream location. Low-frequency variations (periods of a month or more) are also evident. Andres (2021) suggests that some of these variations are related to changes in Gulf Stream transport, as measured in the Florida Straits (https://www.aoml.noaa.gov/phod/floridacurrent/index.php), that cause the cross-stream tilt of the thermocline to vary. An important caveat to this finding is that average Gulf Stream transport doubles between the Florida Straits and Cape Hatteras, increasing from about 30 Sv to 60 Sv (Heiderich and Todd, 2020), implying significant inflow as it transits along the SAB before reaching Cape Hatteras. Additionally, earlier studies have documented several-week-long offshore shifts in the path of the Gulf Stream between the Charleston Bump and Cape Hatteras (Bane and Dewar, 1988).
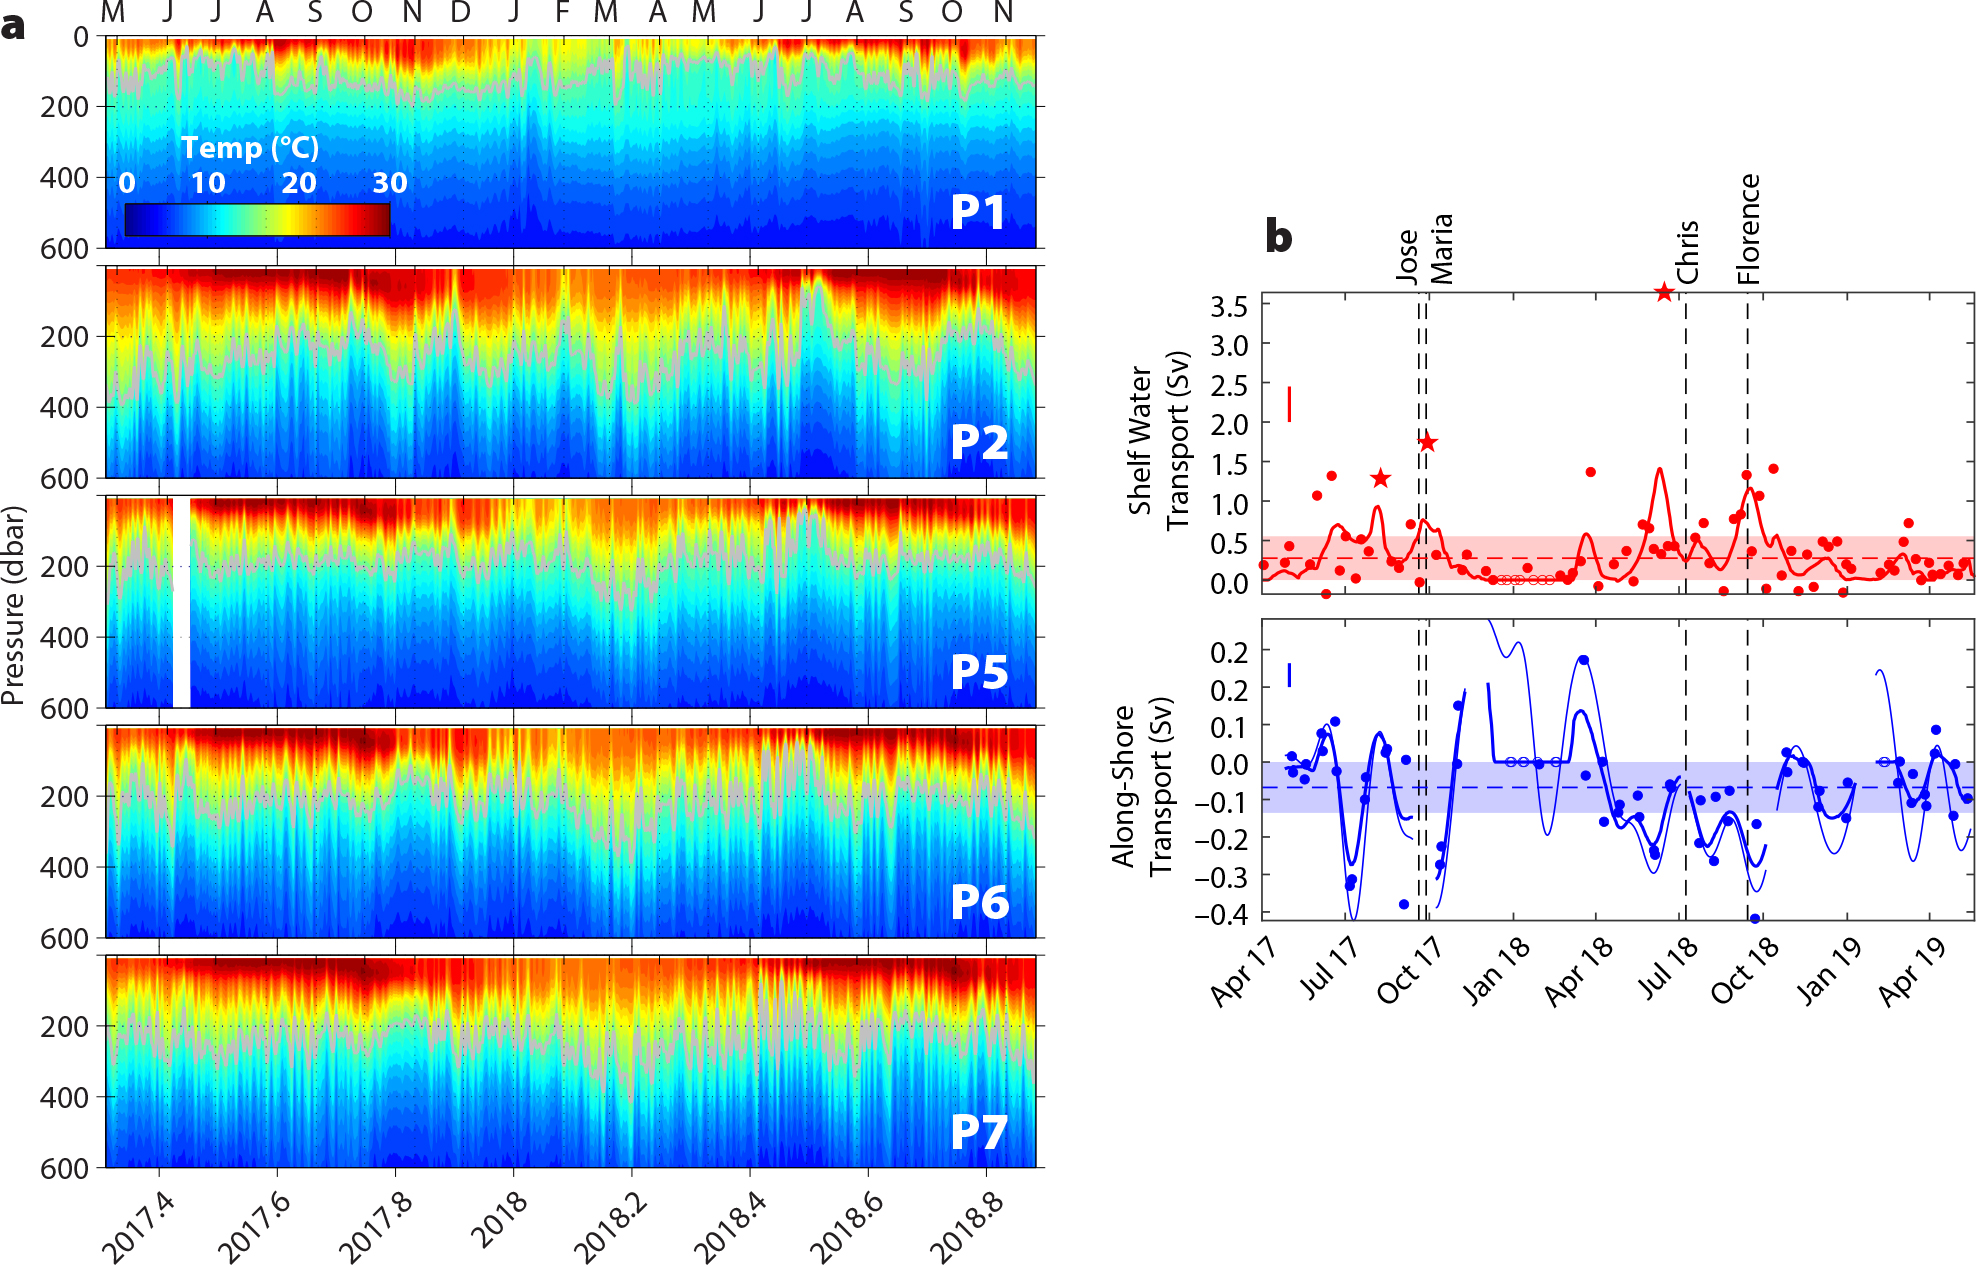
FIGURE 6. (a) Depth-time plots of temperature at CPIES locations shown in Figure 3, from north (top) to south (bottom). (b) Time series of cross-shelf and along-shelf transports in the southern Mid-Atlantic Bight from glider observations along the path shown in Figure 3. (b) From Todd (2020). > High res figure
|
Sustained Spray glider measurements during PEACH captured the mean and variability in the export of MAB shelf waters north of Cape Hatteras (Todd, 2020). The mean export of waters fresher than 34.5, a typical threshold for MAB shelf waters, was 0.3 Sv (Figure 6b, dashed red), in good agreement with prior estimates (e.g., Linder and Gawarkiewicz, 1998). Time series of MAB shelf water export (Figure 6b, red) through the repeated along-shore transect highlight the episodic nature of the export, with 50% of the total MAB shelf water export during PEACH occurring during 17% of the time (Todd, 2020). These export events varied substantially in character, with some being clearly associated with passing tropical cyclones (e.g., Jose and Maria in 2017 and Florence in 2018; Figure 6b), while others were not. Some MAB shelf water export events involved the surface layer and were thus captured by satellite remote sensing, while others, including an event with export exceeding 3 Sv in June 2018 (Figure 6b), involved subsurface export of MAB Cold Pool waters and were undetectable by satellite (Todd, 2020).
During the winter of 2017–2018, a remarkable season-long, near-complete cessation of MAB shelf water export occurred (Todd, 2020). A filament of warm, salty Gulf Stream waters with lower density than the MAB shelf waters persisted along the upper continental slope from Cape Hatteras to near 38°N during this period, resulting in a reversal of the cross-shelf-break density gradient and of the along-slope flow (e.g., Figure 6b, blue; Todd, 2020). The only MAB shelf water export observed by gliders during this period coincided with a five-day cascading event during the January 2018 PEACH cruise that included both MAB and SAB shelf waters. Han et al. (2021) documented how this event led to subduction of chlorophyll- and oxygen-rich shelf waters below the lighter Gulf Stream waters, which concurrently blocked near-surface shelf water export. Similar intrusions of Gulf Stream water along the continental margin north of Cape Hatteras have been documented in satellite imagery (Churchill and Cornillion, 1991), and Han et al. (2021) identified several prior wintertime instances of shelf water cascading events in moored observations at the Ocean Energy mooring site (Figure 3). Subsurface processes like shelf water cascading are likely important pathways for shelf water export, particularly south of Cape Hatteras and at times when near-surface export north of Cape Hatteras is impeded by the presence of Gulf Stream waters along the continental margin.
Shelf moorings captured the strong seasonal temperature cycles north and south of Diamond Shoals. Thermal stratification in the SAB is relatively weak (2°–5°C); the much stronger MAB surface-to-bottom temperature difference reached 15°C in summer due to the persistent Cold Pool there (Figure 7a). Shelf salinities in the SAB were remarkably consistent at approximately 36, while mid-shelf MAB salinities were 32–33 for much of the field program, increasing to nearly 36 during the winter of 2017–2018 when MAB shelf water export ceased. Shelf moorings were used to estimate Hatteras Front position during the study by exploiting the persistent bottom temperature difference between SAB and MAB waters to identify the pair of moorings between which there was the largest bottom temperature difference. Typically, the Hatteras Front remained north of Cape Hatteras (Figure 7a–c), with excursions south of Cape Hatteras associated with strong atmospheric forcing by tropical or extratropical cyclones. During PEACH, the Hatteras Front was north of Cape Hatteras more than 60% of the time.

FIGURE 7. Time series of (a) salinity, temperature, and density at B1 (blue) and B2 (red) moorings from near-surface (Bx1), mid-depth (Bx2), and near-bottom (Bx3) sensors, and Hatteras Front (HF) position. (b) Sea surface temperature on September 22, 2017, showing apparent bifurcation of Mid-Atlantic Bight waters offshore of Cape Hatteras and Hatteras Front position definitions. (c) Distribution of Hatteras Front positions. Glider salinity sections during (d) May 2017 and (e) September 2017. > High res figure
|
The salinity field along one approximately two-week shelf glider track gives a sense of the richness of the shelf mass field (Figure 7d). Along the northern cross-shelf leg, the glider encountered low salinity (S~33) MAB waters with isolated patches of much saltier (S~36) Gulf Stream water. As the glider moved southward, there was an overlying freshet (S<30). A high-salinity feature at the southern end of the glider’s track was initially interpreted as the Hatteras Front, but subsequent examination of SST imagery suggests that the feature may have been part of a Gulf Stream filament or associated with a Gulf Stream meander. A second example from 2017 also shows intrusions of Gulf Stream water in the MAB (Figure 7e) when hurricanes Jose and Maria passed seaward of the study area. These intrusions and smaller-scale interleaving were common features in the shelf glider sampling of the southern MAB. As the storms passed, producing strong southward winds over the study area, the glider was blown out of the southern MAB into the SAB, passing around Diamond Shoals. There was an apparent bifurcation of the MAB waters, with the offshore limb (possibly the SBF) moving into deep water (see Todd, 2020) and the onshore limb moving into the SAB (Figure 7b), a pattern observed repeatedly. This pattern of response to strong southward winds seems to be characteristic of the Hatteras region.
The largely successful PEACH field program did suffer some instrument failures and challenges. Two PIES deployed beneath the Gulf Stream to provide estimates of transport and variability at Cape Hatteras failed to surface; their data would have been especially valuable in further defining Gulf Stream forcing on the area. Conductivity sensors failed on two of the shelf moorings, and their data would have been valuable in tracking the Hatteras Front. Significantly, shelf glider operations were very challenging because of the strong currents. The difficulty in routinely occupying repeat tracks left unfortunate gaps in time and space.
Ocean state prediction off Cape Hatteras turns out to be a more challenging task than we had anticipated. The complex, and multiscale, circulation dynamics here are driven by compounded effects of the Gulf Stream, shelf currents, freshwater plumes, unique coastline/geometry, and steep topography. A misrepresentation of any of these forcing agents can lead to errors in predicting the structure, strength, and timing of ocean state in this region. Because of this, we consider this study area an excellent testing ground for ocean modeling development and validations in the future.
Summary
The PEACH program deployed a multi-platform array off Cape Hatteras, North Carolina, from April 2017 until November 2018 (longer for some components), with mooring lines along the 30 m isobath and the shelf break and CPIES along the 1,100 m isobath and across the continental slope to measure shelf, shelf break, and Gulf Stream properties. Moored observations were augmented by gliders, high-frequency radars, and three cruises. We find the mean current field as measured with the moored array to strongly resemble depictions from the 1990s, indicating along-shelf convergence near Cape Hatteras is a robust feature of the mean circulation. A range of meteorological and Gulf Stream forcings will be examined to determine shelf/shelf break/open ocean system responses. Some of the early findings are that the export of MAB water is very episodic and can cease for months at a time (Todd, 2020), that the Hatteras Front resides north of Cape Hatteras most of the time, and its southern excursions are often wind forced. Gulf Stream intrusions are quite common in the southern MAB, but their frequency relative to other parts of the MAB remains to be explored. Lastly, shelf water cascading, a form of subsurface export, has been documented as an additional wintertime export process operating in the area (Han et al., 2021).
Acknowledgments
We gratefully acknowledge NSF funding (OCE-1558920 to UNC-CH, OCE-1559476 to SkIO, OCE-1558521 to WHOI, OCE-1559178 to NCSU); technical support from Sara Haines, Craig Marquette, Trip Patterson, Nick DeSimone, Erran Sousa, Gabe Matthias, Patrick Deane, Brian Hogue, Frank Bahr, and Ben Hefner; cruise participants Jacob Forsyth, Joleen Heiderich, Chuxuan Li, Marco Valero, Lauren Ball, John McCord, and Kyle Maddux-Lawrence; and the crew of R/V Armstrong for their able support during three PEACH cruises. We also appreciate the observations provided by the NCROEP and collaborations with. J. Edson, C.A. Clayson, P. Robbins, and J. Toole. Paper preparation and finalization took place while D. Savidge was serving at the US National Science Foundation. We thank three anonymous reviewers whose helpful suggestions improved this manuscript.