Full Text
How does the earth speak to you? Or, perhaps even more importantly, how do you get the earth to speak to your students? As oceanographers, and more broadly as Earth scientists, we know that our planet has a fascinating story to tell, one that is full of an amazing array of interconnected facets. What language does it speak? How do we connect students to this story under normal educational circumstances? How about in the middle of a pandemic?
If you have found yourself suddenly needing to revise how you teach your classes and are interested in incorporating more open inquiry using real data, I would like to introduce you to Project EDDIE (Environmental Data-Driven Inquiry and Exploration; http://www.projecteddie.org), funded by the National Science Foundation. (Full disclosure: I am a principal investigator of the project.) Project EDDIE is organized by a community of STEM disciplinary and educational researchers dedicated to providing an onramp for the scaffolded1 analysis of data in the classroom. Participants include faculty from a wide range of STEM disciplines who serve a broad range of student populations at two- and four-year colleges. They create focused lesson plans using EDDIE modules that are designed to be scalable across different skill levels. An “A-B-C” structure based on how students naturally progress through learning objectives of increasing sophistication (Bybee et al., 2006) allows students to develop quantitative skills while making choices about how to use data when addressing aspects of the questions posed. In comparison to a procedure-driven laboratory where we give students questions and tell them how to answer them, EDDIE modules are structured to compel students to ask their own questions and thus become invested in finding the answers through the exploration of a publicly available data set.
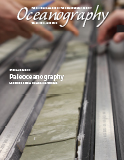
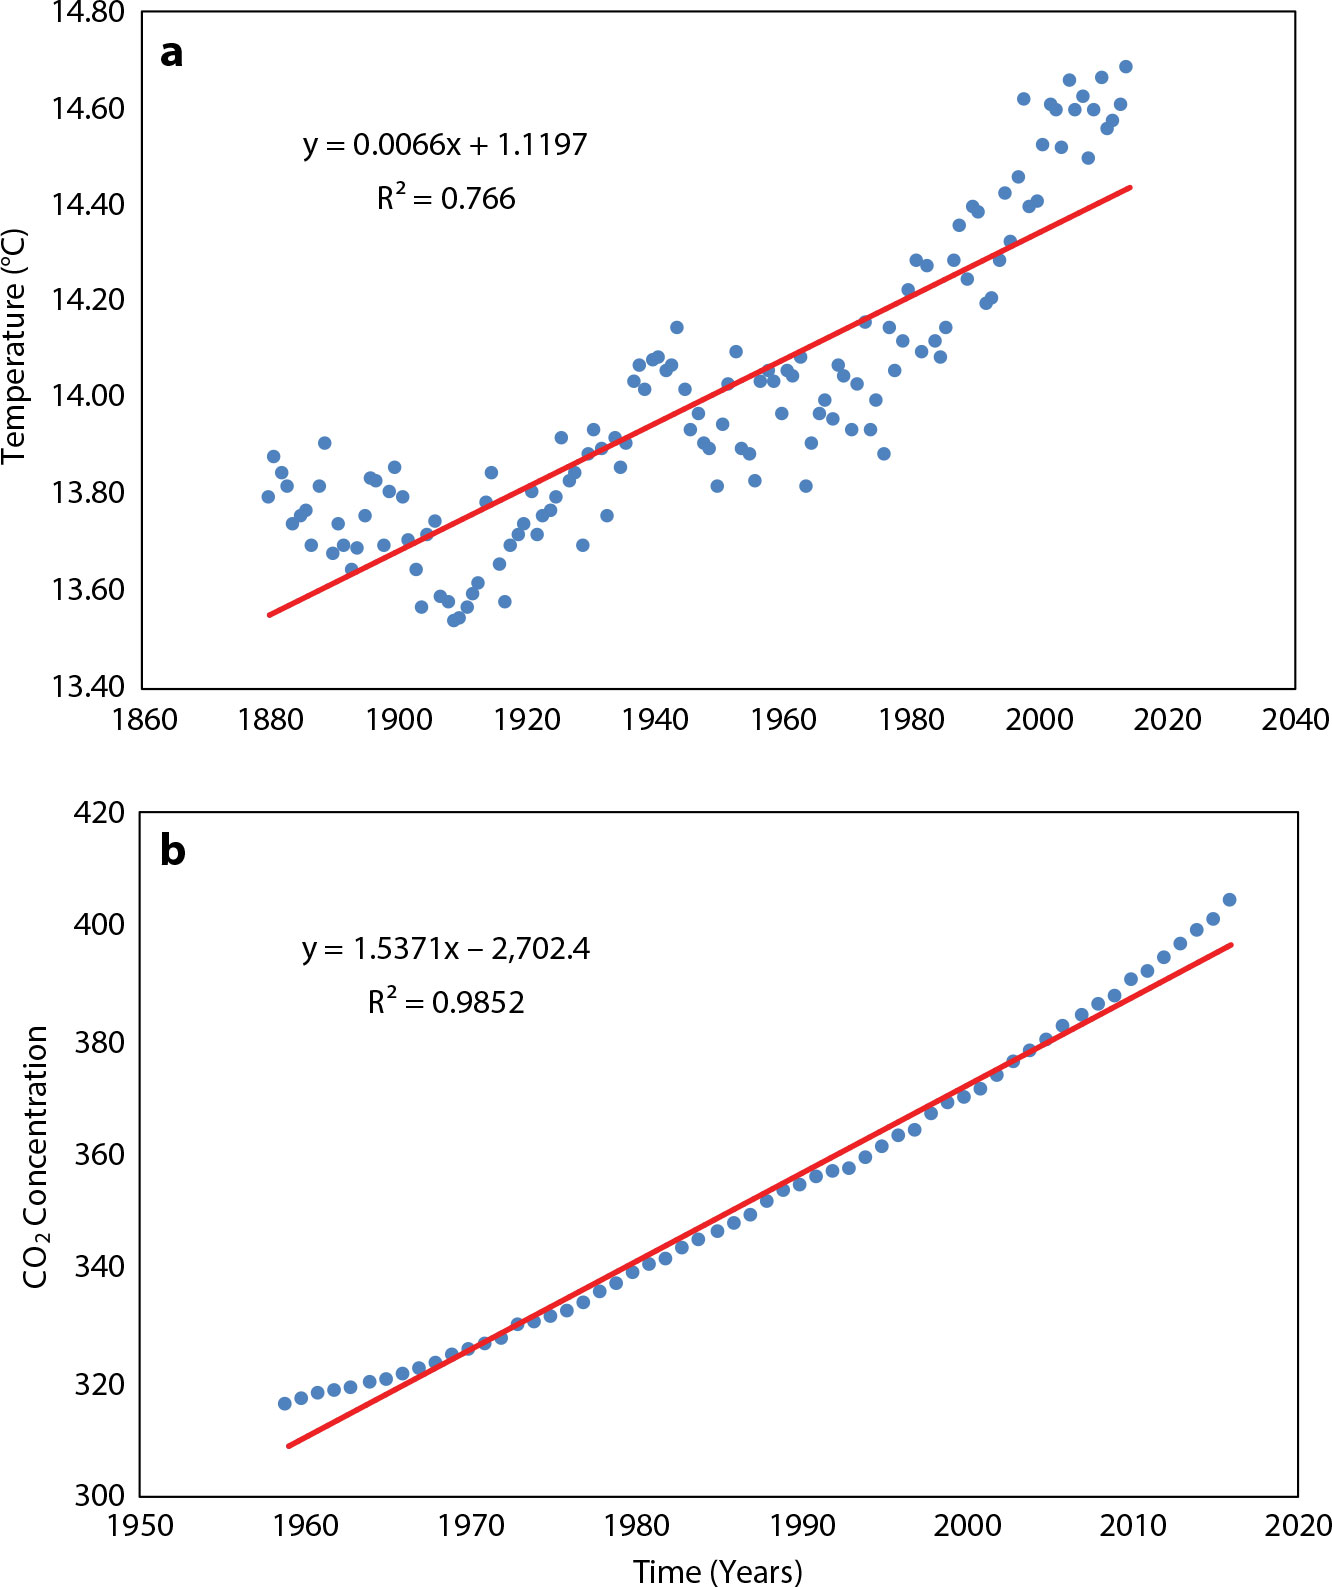
I have used EDDIE modules in a variety of contexts, ranging from large enrollment, multisection courses to small intensive classes focused on time-series analysis. Most recently, I used the climate change module (https://serc.carleton.edu/eddie/enviro_data/activities/climate_change.html) with ~300 students in the lab sections of our non-majors environmental science and geology courses at Queens College (New York City) this past fall. Our students explored the topic of climate change through the analysis of global temperature and atmospheric CO2 concentrations using data compiled by the Earth Policy Institute (http://www.earth-policy.org/data_center/). In this lesson, students start by downloading and plotting the average global temperature from 1880 to the present (Figure 1a) using Microsoft Excel. In part A, students are prompted to calculate the rate of change and the R2 value for the entire time series to determine if they would conclude that the earth appears to be warming currently. To consider the hypothesis that drastic rises in temperature began in the mid-1900s, students can compare the slope and the R2 values for the earlier and later portions of the data set. In part B, we remove some scaffolding, and students do a similar analysis of annual mean CO2 data from the Mauna Loa observatory (Figure 1b) with the goal of establishing a modern rate of change for atmospheric CO2. In part C, students working as almost independent scientists continue to explore how CO2 and temperature have varied together during modern times. At this point, they make all the choices about which data to analyze in order to expand their analyses into how these trends compare to pre-historic rates of change recorded in Vostok ice cores using data available through the Carbon Dioxide Information Analysis Center (CDIAC, https://ess-dive.lbl.gov/).
|
|
Project EDDIE provides instructors with a framework for successful lessons that use data while allowing flexibility for adapting the structure for different learning environments or student populations. All modules are anchored in a relevant scientific question, use real data, and are structured in such a way that students become progressively more independent as they are asked to make increasingly sophisticated choices about how to use their data to address questions and communicate results. Each module contains a set of learning objectives, a student handout, an instructor handout, and a slide set with presentation notes. EDDIE modules also include curated data for instructors who choose not to have students access the public data portals. Our studies demonstrate that in the context of Project EDDIE modules, undergraduates are able to work with large data sets to explore both scientific and quantitative concepts. This opportunity results in significant gains in confidence and technical ability, a greater appreciation for large data sets and computer software, and a stronger understanding of the associated scientific concepts. As an instructor, Project EDDIE has helped me introduce students to using data through guided inquiry and provided a structure for communicating the overarching theme that we are here to do hard things. The more I have incorporated data into my teaching, the more my classroom environment and the process of learning has evolved to resemble the actual scientific process.
The sudden disruption of the status quo brought on by the COVID-19 pandemic can be a catalyst for examining new strategies for engaging your students. Project EDDIE is a vehicle for transitioning students from studying our ocean as an assignment to exploring it as an extension of their own curiosity. The vast wealth of publicly available sensor data available through networks such as the Ocean Observatories Initiative (OOI) can take students beyond the idealized figures and plots typical of an oceanography textbook into a world where the inherent messiness of real data is part of the story. EDDIE modules can compel students to question what they see in a fundamentally more engaged way than a textbook alone can provide as context for developing an understanding of statistics and numeracy.
Perhaps the question is not how you get the earth to speak to our students; the earth speaks continuously. Perhaps the real question is, how do we equip a much broader portion of our society to hear what the planet has to say and do the work of trying to understand what it means? As scientists, we have made a lot of progress in making data available, and the Project EDDIE community is currently developing new modules covering oceanography topics ranging from tides to hypoxia in the coastal environment. If you have an oceanographic module you would like to contribute, join our community and apply to attend one of the forthcoming module development workshops. (Go to the Project EDDIE webpage, https://serc.carleton.edu/eddie/, and sign up for announcements.) Engaging students in the study of our ocean is a way to develop quantitative reasoning skills that have broad relevance, and now more than ever we have an opportunity to use sensor networks as a window to the ocean and seafloor. I invite you to join Project EDDIE and help us figure out how to give students real access to authentic, data-rich learning experiences—even in the middle of a pandemic.