One More Event (Or a Sequence of Events)
Three years ago, with other colleagues, we described the frequent flooding of Venice on the occasion of the 50th anniversary of what had been “the historical flood,” one that was so much worse than any previous or subsequent event (Trincardi et al., 2016). Within the short time since then, two major storms hit Venice, one in 2018 and another in 2019, the latter much worse, but the former potentially more dangerous. These events stimulated new consideration of the flooding problem from different perspectives and at both short and extended timescales.
Venice is not alone in facing these challenges. Low-lying islands, coastal cities, and vulnerable seaside zones are all concerned about the future as sea level rise accelerates. The Venice case may be “the canary in the coal mine,” and because of its fame may be the example that hastens the world to act.
The case of Venice may also be unique in terms of the physics of storm surges. Such events are common in other parts of the world, for example, along the coasts of the eastern United States and Gulf of Mexico, the Gange-Bramaputra delta, and coasts of the southern parts of the North Sea. In these areas, the sea progresses toward an exposed coastline where strong winds blow onshore. What makes Venice storm surges unique is its location at the upper end of an elongated, semi-enclosed basin. Once a storm is over and the winds abate, the basin keeps oscillating for a few days (called seiches; see Cerovečki et al., 1997, for a general description of the process). Venice also has the highest tidal excursion in the Mediterranean Sea, about 1 m at spring tide. The different periods of seiches and tides implies that the magnitude of the flooding depends on the relative phase of these two forcings. Because of their different periods, flood levels vary from day to day after a storm. We have many examples of “the day after” floods, when a still substantial seiche was in phase with the tide, flooding the town under a calm blue sky.
With this knowledge in mind, we frame the paper as follows. In the next section, we summarize Trincardi et al. (2016). We then provide a short description of the 2018 major flooding event. Next, we delve into the 2019 storm and its consequences to provide additional details about its multi-faceted physics, and discuss the problem of predictability and its implications. We conclude by summarizing the current situation in Venice as well as its long-term future, and by briefly describing what people and authorities are doing to face the situation.
What We Thought Three Years Ago
Venetians were optimistic thinking that the 1966 flood was an isolated event, highly unlikely to be repeated in the short term. There was little consideration that another major event could occur before the MOSE (MOdulo Sperimentale Elettromeccanico) gate system, designed to control waters flowing into the three inlets connecting the sea and the Venice lagoon, would be completed (Figures 1 and 2). Although MOSE was expected to be operational in 2018, its completion has been postponed at least to the end of 2021. There have been large national and international efforts to restore many buildings damaged by the 1966 flood.
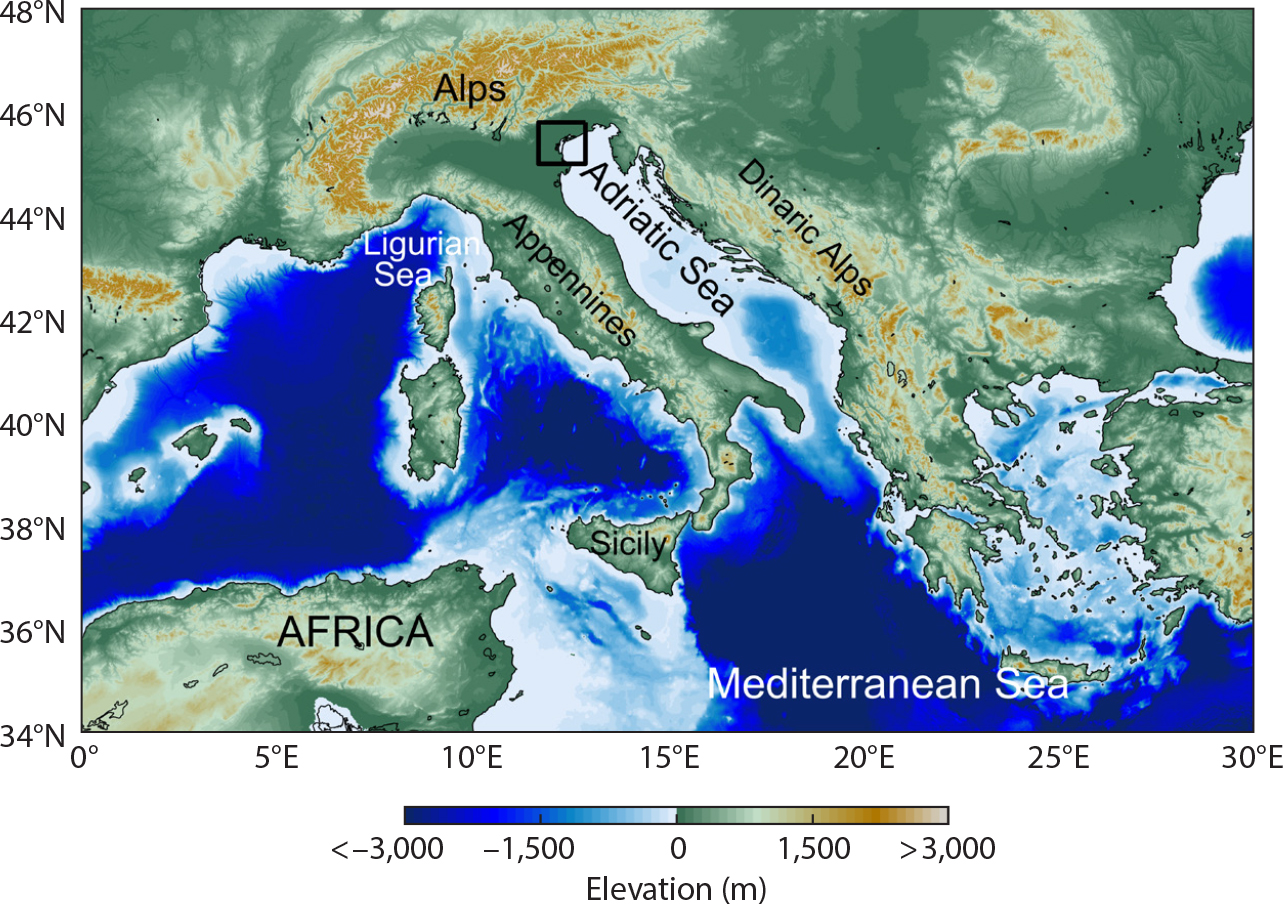
Figure 1. Map of the Western Mediterranean Sea. The black square shows the area in Figure 2 that is focused on the Venice lagoon. > High res figure
|
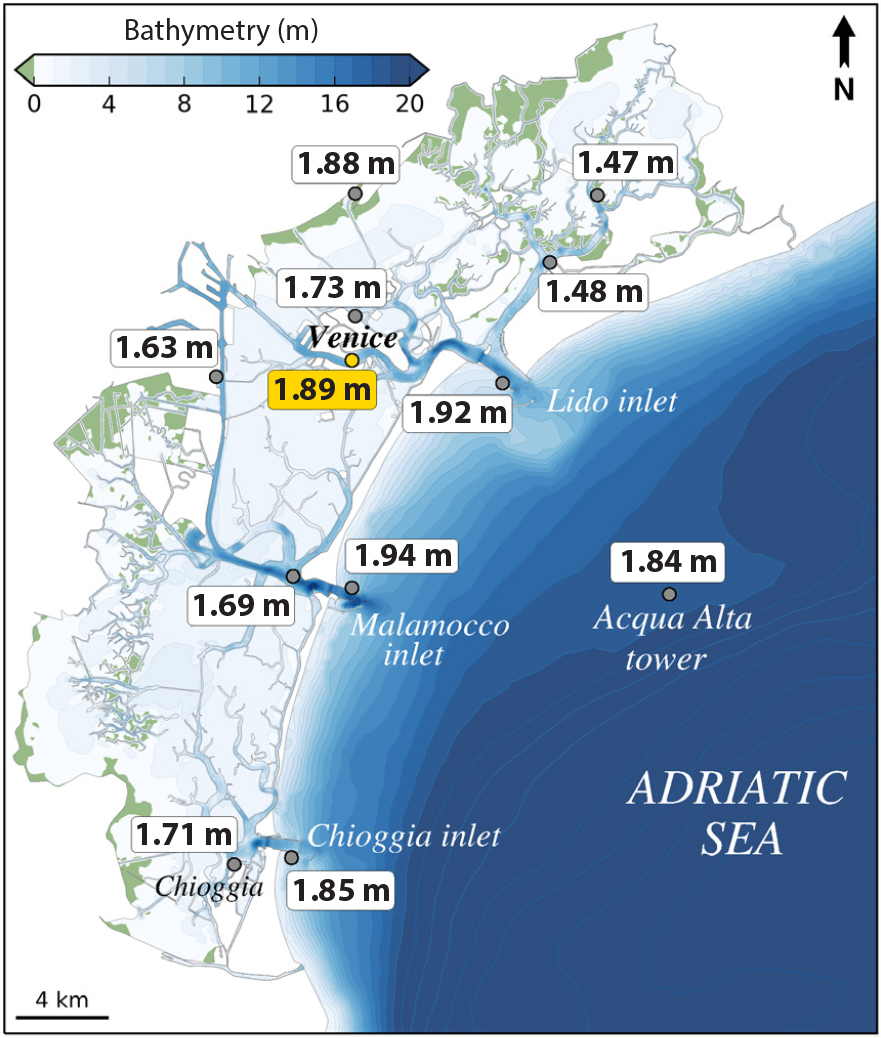
Figure 2. The Venice lagoon (about 50 km long), with the town of Venice at its center. The offshore dot shows the position of the ISMAR oceanographic Acqua Alta tower. The numbers report the maximum sea level reached at various locations inside and outside the lagoon during the November 12, 2019, event. > High res figure
|
Established in 1969, the National Research Council Institute CNR-ISMAR (Institute of Marine Sciences, henceforth ISMAR) had developed the expertise and the capability to monitor the biological, geological, and oceanographic aspects of the 550 km2 Venice lagoon. The Italian Institute for Environmental Protection and Research (ISPRA) and the Tide Forecast and Early Warning Center of the city of Venice (CPSM) manage a dense network of meteorological and oceanographic stations located there. Where possible, much work has been done since 1966 to protect the town and the islands and inhabited dwellings in, or bordering, the lagoon. The forecast capability, with a special eye on tides and waves, had improved tremendously, and it was possible to predict the weather for Venice and its surrounding area a few days in advance (see the regular forecast by CPSM at https://www.comune.venezia.it/it/content/centro-previsioni-e-segnalazioni-maree; see Bajo and Umgiesser (2010) for a detailed description of the local sea level forecast system). The ISMAR oceanographic tower “Acqua Alta,” located 15 km offshore and thoroughly refitted in 2018, was providing a continuous flow of biological, meteorological, and oceanographic data. Scientists and politicians understood that the Venice flooding situation was serious, but felt that it was somewhat under control. As we will see in the next two sections, this was not the case.
A note before quantifying the floods described in the following: water levels in Venice are referenced to the “Punta della Salute” tide gauge, whose zero corresponds to mean sea level during the 1885–1909 period. Today, this reference (ZMPS in Figure 7) is ~0.34 m below present mean sea level (annual MSL). It is maintained as a practical reference so that we know at once which parts of the town are flooded for a given sea level.
The 2018 Event
While the focus of this paper is the November 12, 2019, flood, to better frame the situation, we first summarize the October 29, 2018, event to stress how storm severity is only one of the relevant factors affecting the extent of a flood.
The October 29, 2018, storm hit Italy in different areas. Cavaleri et al. (2019) provide a general description of the storm, focusing on the Adriatic Sea and Venice. Following a low pressure system in the western Mediterranean Sea, typical during fall, an intense southeastern sirocco wind blew for many hours along the Adriatic Sea (Figure 1). In the town of Venice (population about 52,000 within a greater metropolitan area numbering some 260,000), at the upper end of its long basin (see Figure 2 for the lagoon geometry), the storm surge was more than 1.40 m, high for the local standard, but the surge peaked during the trough of the astronomical tide (henceforth “the tide”), and the resulting maximum observed level was “only” 1.54 m. This was sufficient to flood 70% of the town (see Appendix A). Had the storm hit a few hours earlier, Venice would have experienced by far the worst flood in its history (>2.10 m, at least 0.16 m above the 1.94 m level reached in 1966).
Physics and Evolution of the November 12, 2019, Flood
As is typical during fall, a deep, large-scale pressure minimum was located on the western side of the Mediterranean Sea, just north of Sicily (Figure 3a). Note that for our analysis and modeling we have used the data of the European Centre for Medium-Range Weather Forecasts (ECMWF). The minimum was squeezed between two high-pressure zones, one over the Atlantic Ocean and the other over Eastern Europe. On the day of the flood, the northerly elongation of low pressure led to dense isobars across the Adriatic. Combined with the channeling effect from the mountain ranges bordering the sea (Apennines to the west, Dinaric Alps to the east), sustained southeastern sirocco winds blew all over most of the narrow basin. High waves were present on the east coast, while conditions were less severe in the Gulf of Venice, with the wind blowing from the northeast. At the ISMAR oceanographic tower (Cavaleri, 2000), the significant wave height was about 4 m, less than 50% of the wave energy recorded during the 2018 storm. Fully expected and well forecast, this meteorological situation resulted in an estimated surge of about 0.70 m, high, but not exceptional, as compared to the 1.40 m in 2018. However, three additional factors combined to increase the overall level.
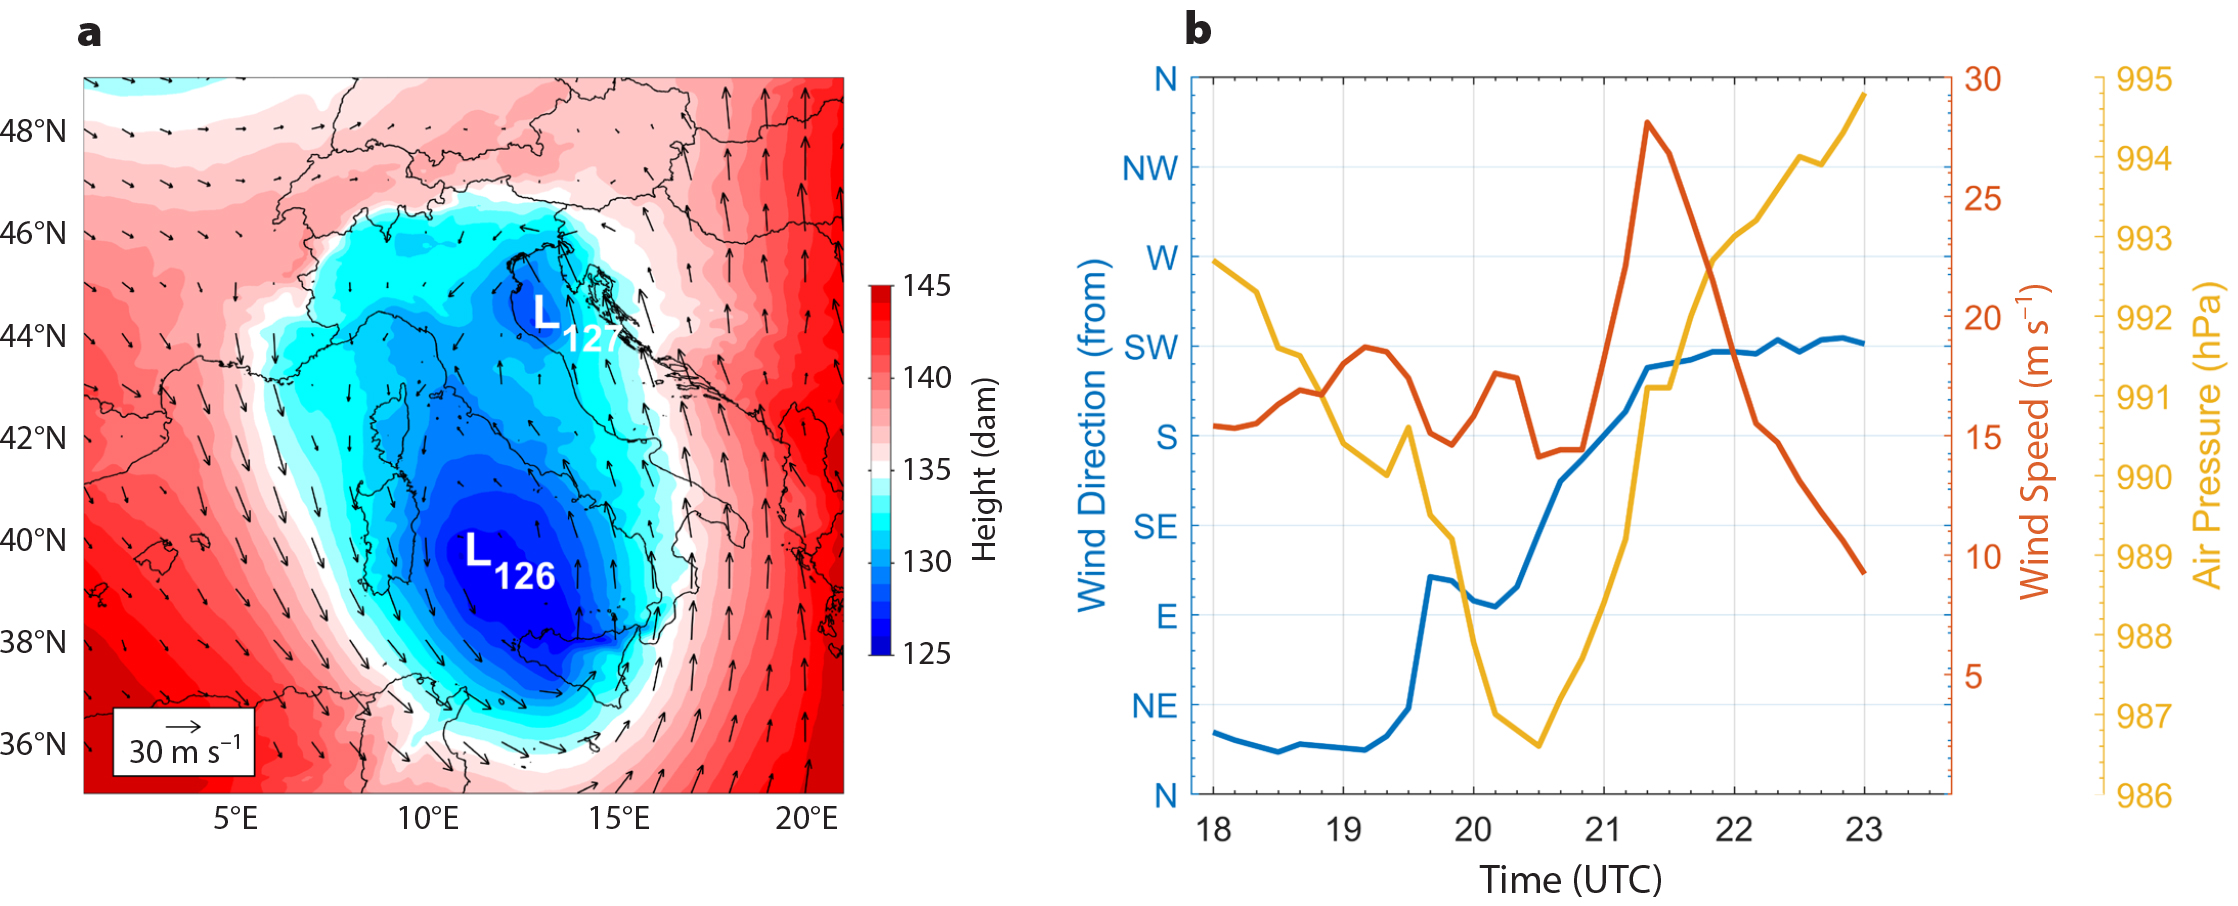
Figure 3. The two panels show different aspects of the evolution of the November 12, 2019, storm in the northern Adriatic Sea. (a) The 850 mb geopotential height at 18:00 UTC (ECMWF data). The locations of the two geopotential height minima are marked with an L and associated height value in dam. (b) Air pressure and wind speed and direction measured at the Acqua Alta tower between 18:00 UTC and 23:00 UTC. > High res figure
|
The first of these was the tide. November 12 happened to be the day of the full moon, and the surge coincided with one of the tidal peaks (+0.26 m), although the two bordering peaks, 12 hours before and after, were even higher. The second element was the unusual high level of the Mediterranean Sea in November, reflecting an anomalous general atmospheric depression over the basin. Finally, a deep small-scale atmospheric pressure minimum developed over the Adriatic, moving rapidly northward and passing over the Venice lagoon, just west of the town. Figure 4 shows the average atmospheric pressure over the November 9–15, 2019, period as compared to the 1989–2008 mean value. Note in particular the large negative values in the northern part of the basin, including the northern Adriatic Sea. The recorded tidal data of the previous days, in the absence of any particular meteorological events, suggest that this contribution corresponded to an extra +0.30–0.35 m of surge. These three factors, added together, would have led to an overall 1.50–1.60 m flood, similar to the October 29, 2018, event. This was indeed what was anticipated by the forecasting centers CPSM and ISPRA. However, around 12:00 UTC, a small center of low pressure formed in the middle Adriatic Sea, close to the Italian coast. It moved quickly northward and had a deepening central depression, though its dimensions remained small. By 18:00 UTC, the depression had moved further north and was heading rapidly toward the Venice lagoon, and it was forecast to pass on its left. Figure 5 shows the different paths the meteorological depression might have followed, along with its associated strong rotating winds, according to the forecasts issued by ECMWF from one to four days earlier. We discuss the implications in more detail in the next two sections.
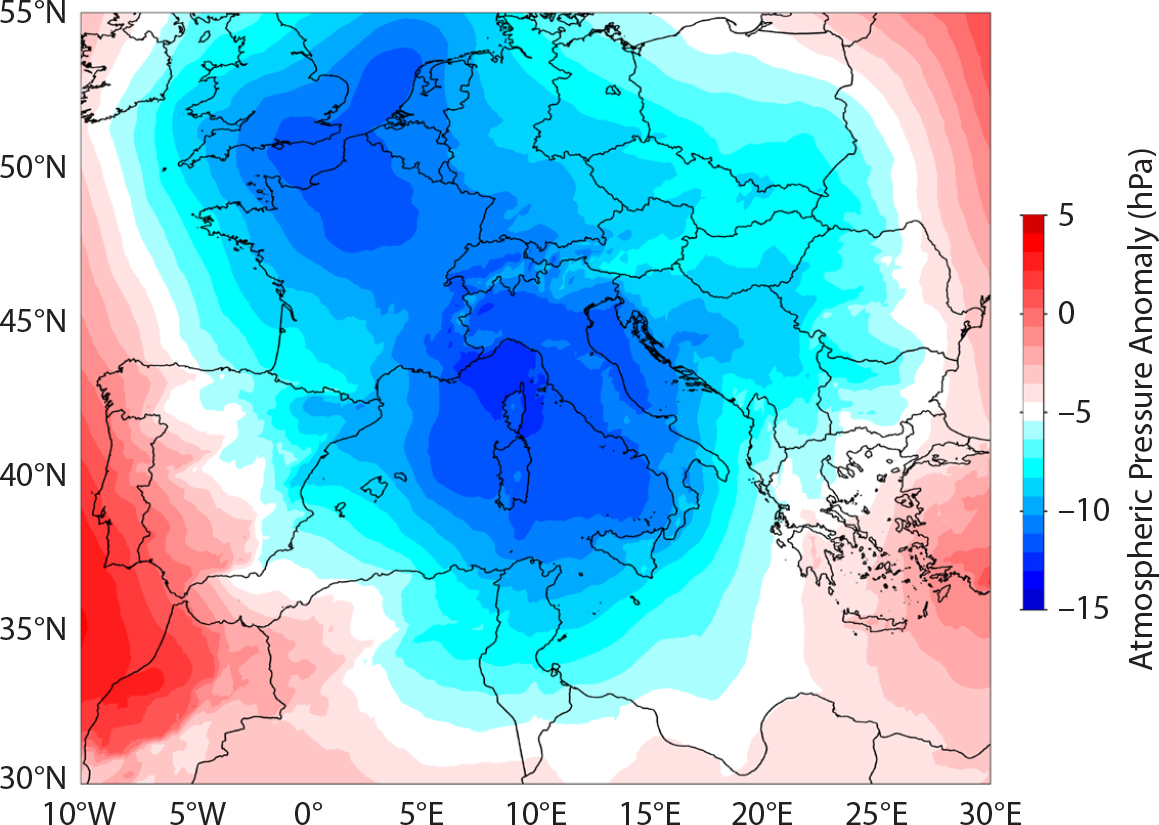
Figure 4. Average sea surface atmospheric pressure anomaly (hPa) over the Mediterranean Sea for the week of November 9–15, 2019. Reference is the mean value of the 1989–2008 period. Data are from ECMWF. Figure courtesy of Linus Magnusson. > High res figure
|
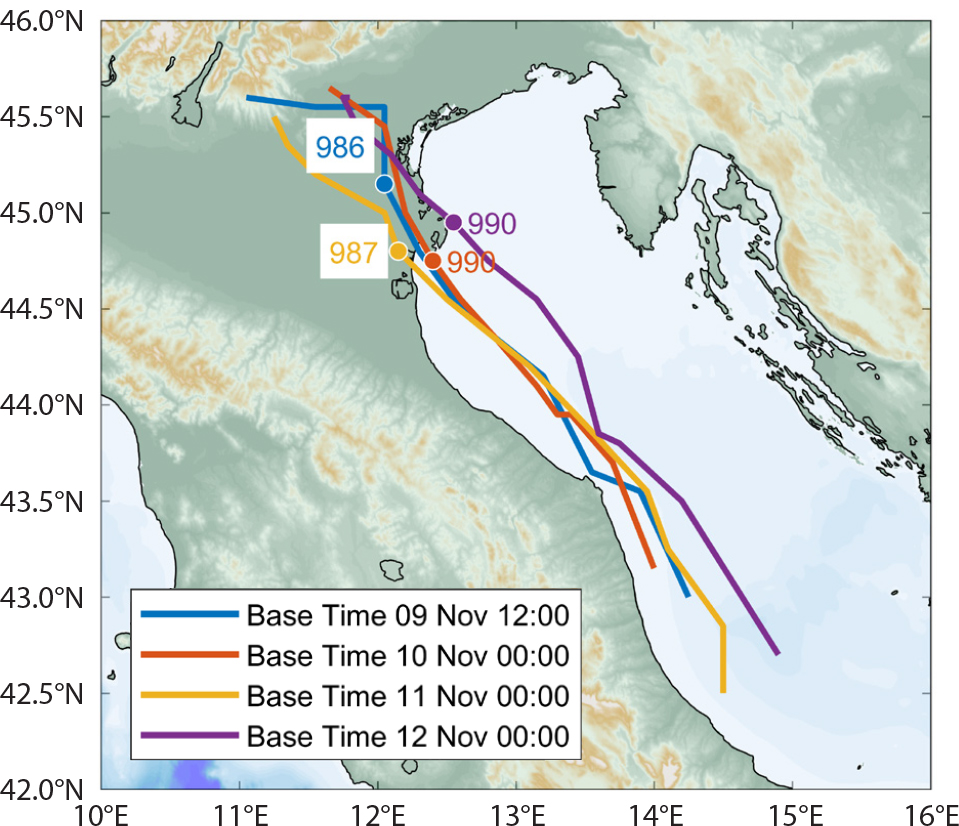
Figure 5. Expected tracks of the pressure minimum (L127 in Figure 3) for November 12 at 12:00–24:00 UTC according to the ECMWF forecasts (see legend for the base time). Location (circle) and value (in hPa) of the respective pressure minima are also shown. > High res figure
|
Figure 6 shows the pressure and wind fields in and around the Venice lagoon expected at 21:00 UTC according to the latest available forecast, issued at 12:00 UTC on November 12. The track of the atmospheric pressure minimum is located well off the lagoon, about 40 km west of Venice. However, in the figure we also show the wind speeds and directions recorded at the same time, 21:00 UTC, by a series of anemometers, including those at the offshore Acqua Alta oceanographic tower. The recorded data set strongly suggests that the minimum passed over one of the lagoon’s barrier islands, about 10 km only west of Venice. Based on this local evidence, we have also indicated the possible location (white circle) of the minimum at that time.
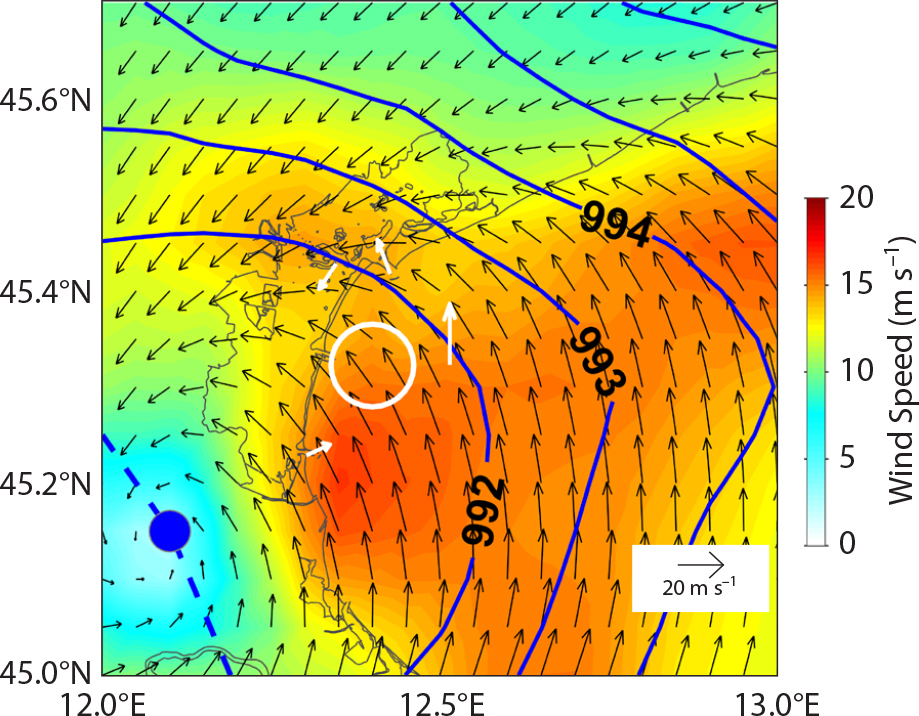
Figure 6. Close-up of the area of the Venice lagoon (see Figure 1 and Figure 2 for location), 10 m wind (arrows, m s–1), and mean sea level pressure (blue lines, hPa) at 21:00 UTC from the ECMWF forecast issued at 12:00 UTC. Wind measurements at 21:00 UTC are plotted in white. The forecast track of the minimum pressure is shown as a blue dotted line along with the location of the minimum at 21:00 UTC (blue circle). The white circle indicates the possible position of the minimum as derived from the local wind measurements. > High res figure
|
This localized event had two consequences. By moving parallel to the shallow coastal area north of the protruding Po River delta (15–30 m depth) at about 12.5 m s–1, the traveling atmospheric disturbance may have been resonantly coupled either to gravity waves (Proudmann, 1929) or to edge waves (Greenspan, 1956; Munk et al, 1956) in the coastal sea. Combined with wave setup (Longuet-Higgins and Stewart, 1964), such a coastal wave, if confirmed, may have rapidly raised the sea level in front of the lagoon. However, this wave did not have time to fully propagate in the lagoon, contributing, but also sparing, a few further centimeters to the level the water reached in Venice. However, the pressure minimum had dramatic consequences once it entered the lagoon. The inverse barometer effect (i.e., sea level rising in areas with lower atmospheric pressure) had most likely limited consequences here because of the very short timescale and shallow water of the lagoon. The key to the severe flooding was the sudden, violent, short-lived (less than one hour) westerly wind that appeared soon after the minimum moved northward. Contrary to the inverse barometer effect, the wind may have been extremely effective in raising water levels when blowing across shallow water. Thus, water that had been pushed by previous northeastern wind and piled up at the southwesterly end (Figure 2, lower left) was effectively pushed against that side of Venice (where Saint Mark’s Square and the classical promenade are located) resulting in a Venice tide gauge peak value of 1.89 m and flooding of 85% of the town.
Figure 7 provides a good summary of the flood’s evolution. To avoid local effects in the lagoon, we show the data recorded at the ISMAR oceanographic tower (Figure 2). We see at once that the November mean sea level was 0.33 m higher than the annual average. The astronomical tide excursion, added to the November sea level, clearly shows how in that period normal tides were already sufficient to flood part of the town (see Appendix A). Then, we had the storm surge (referenced to the 0 line) that, added to the tidal peak in the evening of November 12, led to the disastrous combined large value.
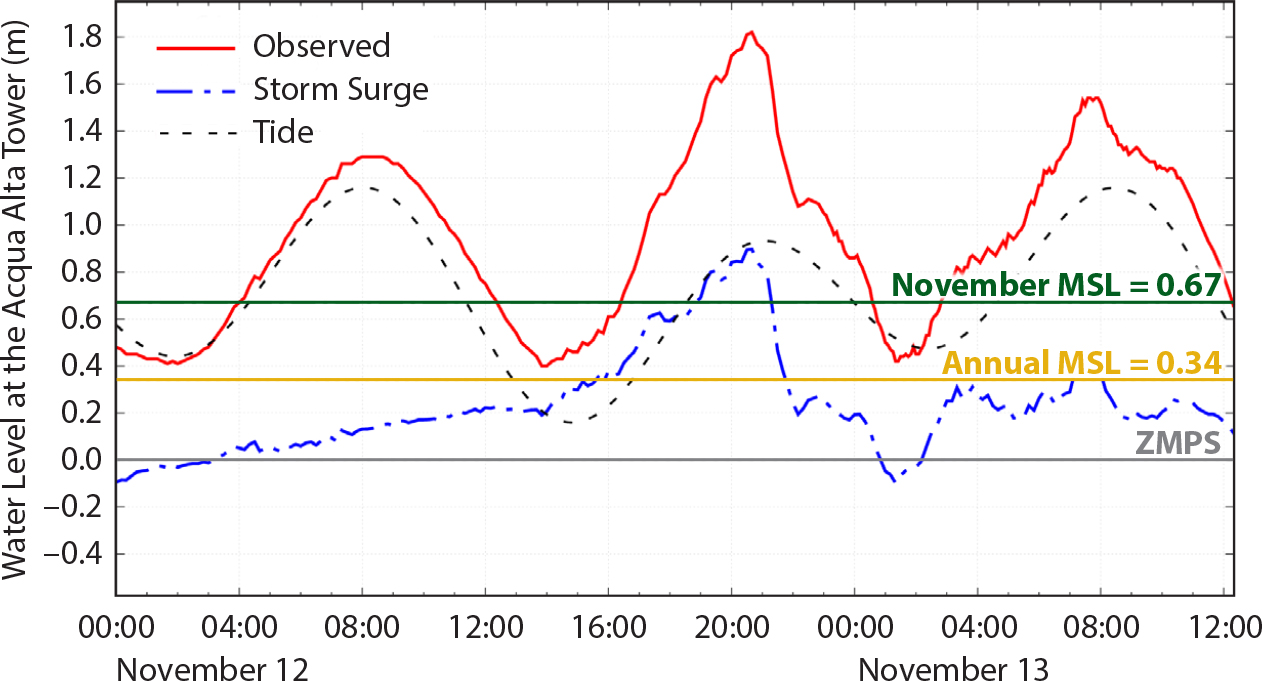
Figure 7. Evolution of sea level as recorded at the ISMAR Acqua Alta oceanographic tower (see Figure 2 for its location). ZMPS is the 0 nominal reference for Venice flooding. Annual mean sea level (MSL) is the present mean sea level (2019 annual average). November MSL is calculated as for annual, but just for November. The dashed line is the expected astronomical tide. The dash-dot blue line shows the storm surge contribution. The red line is the overall resulting sea level. > High res figure
|
Waves made local conditions dramatic. The lagoon is shallow, but its average depth has been progressively increasing from 1.2 m to 1.5 m (but not in the canals; see Carniello et al., 2009; Madricardo et al., 2017). Under strong wind conditions, these depths still allow significant wave heights up to 0.5–0.6 m (40% of the depth—single maximum values up to 0.8–1.2 m). These values increase correspondingly when the depth increases because of storm surge. Combined with the large open area facing the promenade and its relatively greater depth because it is used for navigation, the strong wind could generate large (for the area), steep breaking waves capable of sinking large boats or pushing them ashore and also sinking or sending adrift pontoons (“imbarcaderi”) used to board the public service boats.
Figure 2 shows the distribution of the maximum overall tidal level reached at the various locations in the lagoon and at the inlets, as well as at the oceanographic tower 15 km offshore. Note the difference between the south and north sides of Venice. The difference, 0.16 m in the figure, probably had a larger maximum value because the two peak values were not necessarily reached at the same time. This explains the strong flow of water (we hypothesize 2 m s–1, also supported by available videos) in the canals connecting the two sides of the city (Bernoulli, 1738; see also Lamb, 1932), including in a former canal that was once one of the largest, but that was converted to a street in 1807 and is now called via Garibaldi—the historical storm returned it, for a while, to its original watery condition and function. Note that the small canals of the town, and for obvious reasons also via Garibaldi, are not considered when modeling the lagoon.
The storm quickly abated, lasting less than one hour, the time for the local minimum to cross the lagoon, but leaving destruction of the town behind. The wind effect on the overall sea level is readily seen in Figure 7 noting the quick drop soon after the peak. Note also, from the surge contribution, that there was no major imbalance of the basin, hence practically no seiche. This saved Venice from a repeated dramatic flood 12 hours later when a higher tide occurred, but with a limited meteorological contribution. This notwithstanding, the result was a remarkable 1.58 m level, but less extreme than the previous one. The tidal data for early November 11, 2019, are available in online supplementary Table S1. The whole history for November 11–14, 2019, is available at https://owncloud.ve.ismar.cnr.it/owncloud/index.php/s/34RB1z2MqdvIsqf.
Predictability
The capability to forecast weather has greatly advanced in recent years. We are now used to checking the next weekend’s weather several days in advance, and on the basis of those forecasts, we make plans. With an operational meteo-oceanographic tower in Venice, we are used to checking forecasts up to one week in advance, each day monitoring the evolving forecast. Indeed, the forecast for November 12 was clear. There was a large atmospheric depression over the Mediterranean Sea (Figure 3a) and the associated expected sirocco wind blowing over the Adriatic. We also knew from previous days’ conditions about the high water level in the Mediterranean, and we know the astronomical tide well in advance. In this respect, a longer range (e.g., three or four days) forecast has some uncertainty because we may be reasonably sure of how the situation will evolve, but not so sure about its exact timing. This can be critical for combining a meteorological surge with the peak or trough of the tide. In any case, there was a level of uncertainty about the actual storm intensity. On November 11, we were pretty confident about how the storm was going to evolve, and indeed the latest official CPSM forecast was for about 1.50 m peak water height. However, no one, including those involved in the forecast system, paid sufficient attention to the small-scale local depression traveling alongshore in the Adriatic Sea that led to the final 1.89 peak Venice value.
We now briefly discuss the sensitive range of small-scale features in meteorological forecasts. The present spatial resolution of global meteorological models succeeds (within limits) in identifying β-mesoscale atmospheric disturbances (with dimensions between 40 m and 100 km; see Ray, 1986). Indeed, although possibly underestimated, ECMWF (whose predictions are used by CPSM for the local tidal information) had forecast the formation of the meteorological depression days in advance, in itself a remarkable achievement. However, the characteristics, such as the minimum pressure, and more so the path, of these small features depend on details of the three-dimensional field and are not always available or properly represented in the present resolution (9 km for the ECMWF Tco1279 model). The lowest model pressure of the local minimum was 991 hPa compared to the 986 hPa measured at the oceanographic tower.
Figure 5 shows the forecast trajectory of the minimum pressure at one, two, three, and four days in advance. A meteorologist would probably be pleased (“we got it four, possibly more, days in advance”), but the differences are crucial when the consequences can be very local, as it was the case for Venice and part of the northern Adriatic Sea in the evening of November 12. Note in Figure 5 that just at 00:00 UTC November 12 (purple track) there were indications for a passage close to the lagoon. However, while the 00:00 UTC forecast showed the minimum as passing very close to the southwest end of the lagoon, the 12:00 UTC forecast, in principle the most accurate one, was already different, setting the passage fully south of the lagoon. Neither was correct. The real passage of the low-pressure system, as strongly suggested by the extensive measured data, was just 10 km west of Venice, the worst position for damage to be inflicted by the ensuing wind.
Summary and a Look at the Future
The November 12, 2019, flood resulted from a combination of factors, each unexceptional when viewed separately, except for the wind during the evening. The storm surge following the sirocco wind was “only” 0.70 m, in itself minor compared to many other historical events. However, the winds coincided with one of the full moon tidal peaks. All of this was superimposed on a higher than usual local sea level due to a prolonged negative pressure anomaly in the Mediterranean, in particular over the Adriatic Sea. Finally, the strong winds driven by the fast-moving depression pushed the lagoon’s water against the south face of Venice.
Figure 7 shows that things could have been much worse had the combination of meteorological factors happened 12 hours before or after. The tidal peaks were about 0.25 cm higher at those times and would have pushed the overall water level up to about 2.10 m. Note that this is the same order of magnitude that would have been reached in 2018 had the storm hit during the peak, instead of the trough, of the tide.
These events, and an estimate of the probability of their reoccurrence, must be considered in combination with steadily rising global sea levels. Current estimates are that sea level is rising at 3.5 mm yr–1 (Ablain et al., 2019), but that figure is steadily increasing (Clarck et al., 2016). When combined with 1.5 mm yr–1 of land subsidence (Tosi et al., 2018), Venice is now losing 5 mm yr–1 with respect to the sea. More extreme floods are expected, as well as more “regular” floods. Today, especially after the last two stormy seasons, Venetians accept flooding as a normal part of daily life, but we must be aware that things are getting worse. In a relatively short timeframe (the horizon is 2050), global mean sea level is expected to be, with few uncertainties, between 0.24 m and 0.32 m higher than at present (IPCC, 2019). Thus, the November 2019 flooding of Venice is likely to represent what normal tides will be like in the not too distant future. Appendix A shows which parts of Venice will flood at three different sea levels.
How does Venice cope with this situation? First, forecasts of sea level in the lagoon for the coming four or five days are reliable. The meteorological forecast is reliable as well, and the oceanographic model (Mediterranean plus Adriatic Seas plus the lagoon; see Bajo and Umgiesser, 2010) is well tested. The local CPSM also uses a statistical regressive model based on recent days plus current atmospheric pressure and wind speed data for the Adriatic Sea. The availability of accurate meteorological information is indispensable for obtaining reliable tide level forecasts. For Venice flooding, this is mostly the case because the strong sirocco winds—the classical source of storm surges in Venice—are usually associated with large-scale meteorological systems. This was the case in 2018, and partly in 2019. However, as explained, on November 12 the final contribution to flooding resulted from a small meteorological minimum and the associated relatively local, very strong wind. The tidal forecast system failed for two reasons: the spatial gradients of the atmospheric depression and associated winds were underestimated, and the predicted path of the depression was incorrect.
In fact, the underestimated pressure minimum passed much closer to Venice than suggested by the last forecast. In meteorological modeling, such uncertainties are explored using multiple parallel runs of models with reduced, typically halved, resolution. The model physics and initial conditions are slightly and suitably modified to consider their overall uncertainty. Could such ensemble modeling have suggested anything different for Venice? CPSM receives the related 50+1 members of the ECMWF ensemble forecast. However, they are still treated in a qualitative way and only as meteorological information. Indeed, a few ensemble members were indicating passage of the depression above the lagoon. The uncertainties related to both wind speed associated with the depression and its path were summarized in the overall local forecast message indicating “the possibility of tidal levels higher than 1.50” (i.e., the expected peak level apart from the meteorological low).
Ensemble forecasts need to be given more quantitative consideration, but with half the resolution of the ECMWF Tco1279 model, their uncertainties are larger and wind speeds are further reduced. While ensemble forecasts could provide relevant information about the possible trajectory of atmospheric depressions, the Tco1279 model we use is a more accurate predictor of wind speed. Using available meteorological information, another possibility for producing more accurate forecasts might be running a nested higher resolution limited area model. Another improvement might be assimilating meteorological and oceanographic data in models (for a general discussion, see Carrassi et al., 2018). However, with the improvements already made to the surge model, all that is required is the ability to run it N times. This has not yet been done. The problem of how to quantify to the public the derived approximations and possibilities in an understandable and convincing way remains.
This cloud of uncertainty strongly limits the time range of a useful forecast. While there is a progressive decrease in forecast reliability for longer time spans, reliable meteorological forecasts are generally available for several days in advance. Given the astronomical precision of the tide, we could extend the overall sea level forecast for the lagoon beyond the present five-day range. However, the problem is meteorological. Relatively speaking, forecasts are often more correct in what than in when. At a five-day range (i.e., 120 hours), no one expects, for example, the possible front to arrive with an accuracy better than five hours or more. The key point is that, when combining tide with surge for the overall sea level information, the precise timing of the latter is crucial in determining the final result. This puts another strong limit on the time extent of a reliable local forecast.
Given this forecast uncertainty, how are Venetians reacting? Many ground floor establishments such as apartments, shops, restaurants, workshops, and hotels have developed some type of sophisticated protection while waiting for the large MOSE barriers to be completed. This ranges from a vertical barrier, 50–60 cm high, installed when needed at the entrance door, to more sophisticated systems of double barriers with a pump to remove any water, to having the ground floor sealed in a concrete tank. These systems, developed for “normal” floods, cannot cope with extreme events such as those of November 2019. The longer-term solution is the MOSE multiple barrier system at the lagoon’s three inlets (see Figure 2 for their positions). Its completion is now scheduled for 2021. However, although on a different timescale, we must realize that MOSE will not be a permanent solution. A detailed analysis done by Umgiesser (2020) shows how progressively rising sea levels, hence, the increasing number of once exceptional floods, will require more and more frequent use (closure) of the system. In addition to the harbor and engineering challenges of repeated closure, lagoon-seawater exchange will be much reduced, with substantial implications for the lagoon ecosystem as a whole.
With this perspective in mind, scientists and politicians argue about a long-term solution to Venice’s water problem. Since the fourteenth to the seventeenth centuries when inflowing rivers were diverted away from the lagoon (see Dal Paos, 2019), the lagoon has been deepening and progressively reverting to again be part of the sea. Combined with rising sea levels, Venice must shift toward artificial solutions to keep the sea at bay, different from those currently in place. For example, Gambolati and Teatini (2013) suggest raising Venice by a limited, but significant amount by pumping seawater into deep aquifers. Apart from the technical and practical challenges, this solution has not had a positive reception from the community. Venice is open to other suggestions.
Can Venice serve as an example for other coastal locations where the future is forcing people to find local solutions to sea level rise? On the one hand, Venice is an example of a local reaction to the problem. On the other hand, the problems resulting from sea level rise very much depend on local conditions. To help each other find the best local solutions, we, as a global community, must find ways to exchange ideas and information. We need to face this problem not as a scattered, but as a single, unified community.
Acknowledgments
The recorded sea level and wind data cited in the paper derive from the measuring network of the Italian Institute for Environmental Protection and Research (ISPRA) and the Tide Forecast and Early Warning Center of the city of Venice (CPSM). We are pleased to acknowledge our continuous effective cooperation with both these organizations. CPSM has also supplied Figure 2 and the panels in Appendix A. The meteorological model data are from ECMWF, Reading, UK, with which two of us (LB and LC) acknowledge long-term cooperation. Linus Magnusson of ECMWF provided the data and the material for Figure 4. Several of our ISMAR colleagues helped keep the computer system going during the flooding. This work was partially supported by the Integrated Sea sTORm Management Strategies (I-STORMS) project funded by the European Union under the Interreg V-B Adriatic-Ionian program with agreement no. 69 of March 9, 2019. Two anonymous reviewers, Jean Bidlot, and Oceanography editor Ellen Kappel provided a substantial number of constructive comments on the first version of this paper, leading to a more clear and straightforward message.
Appendix A
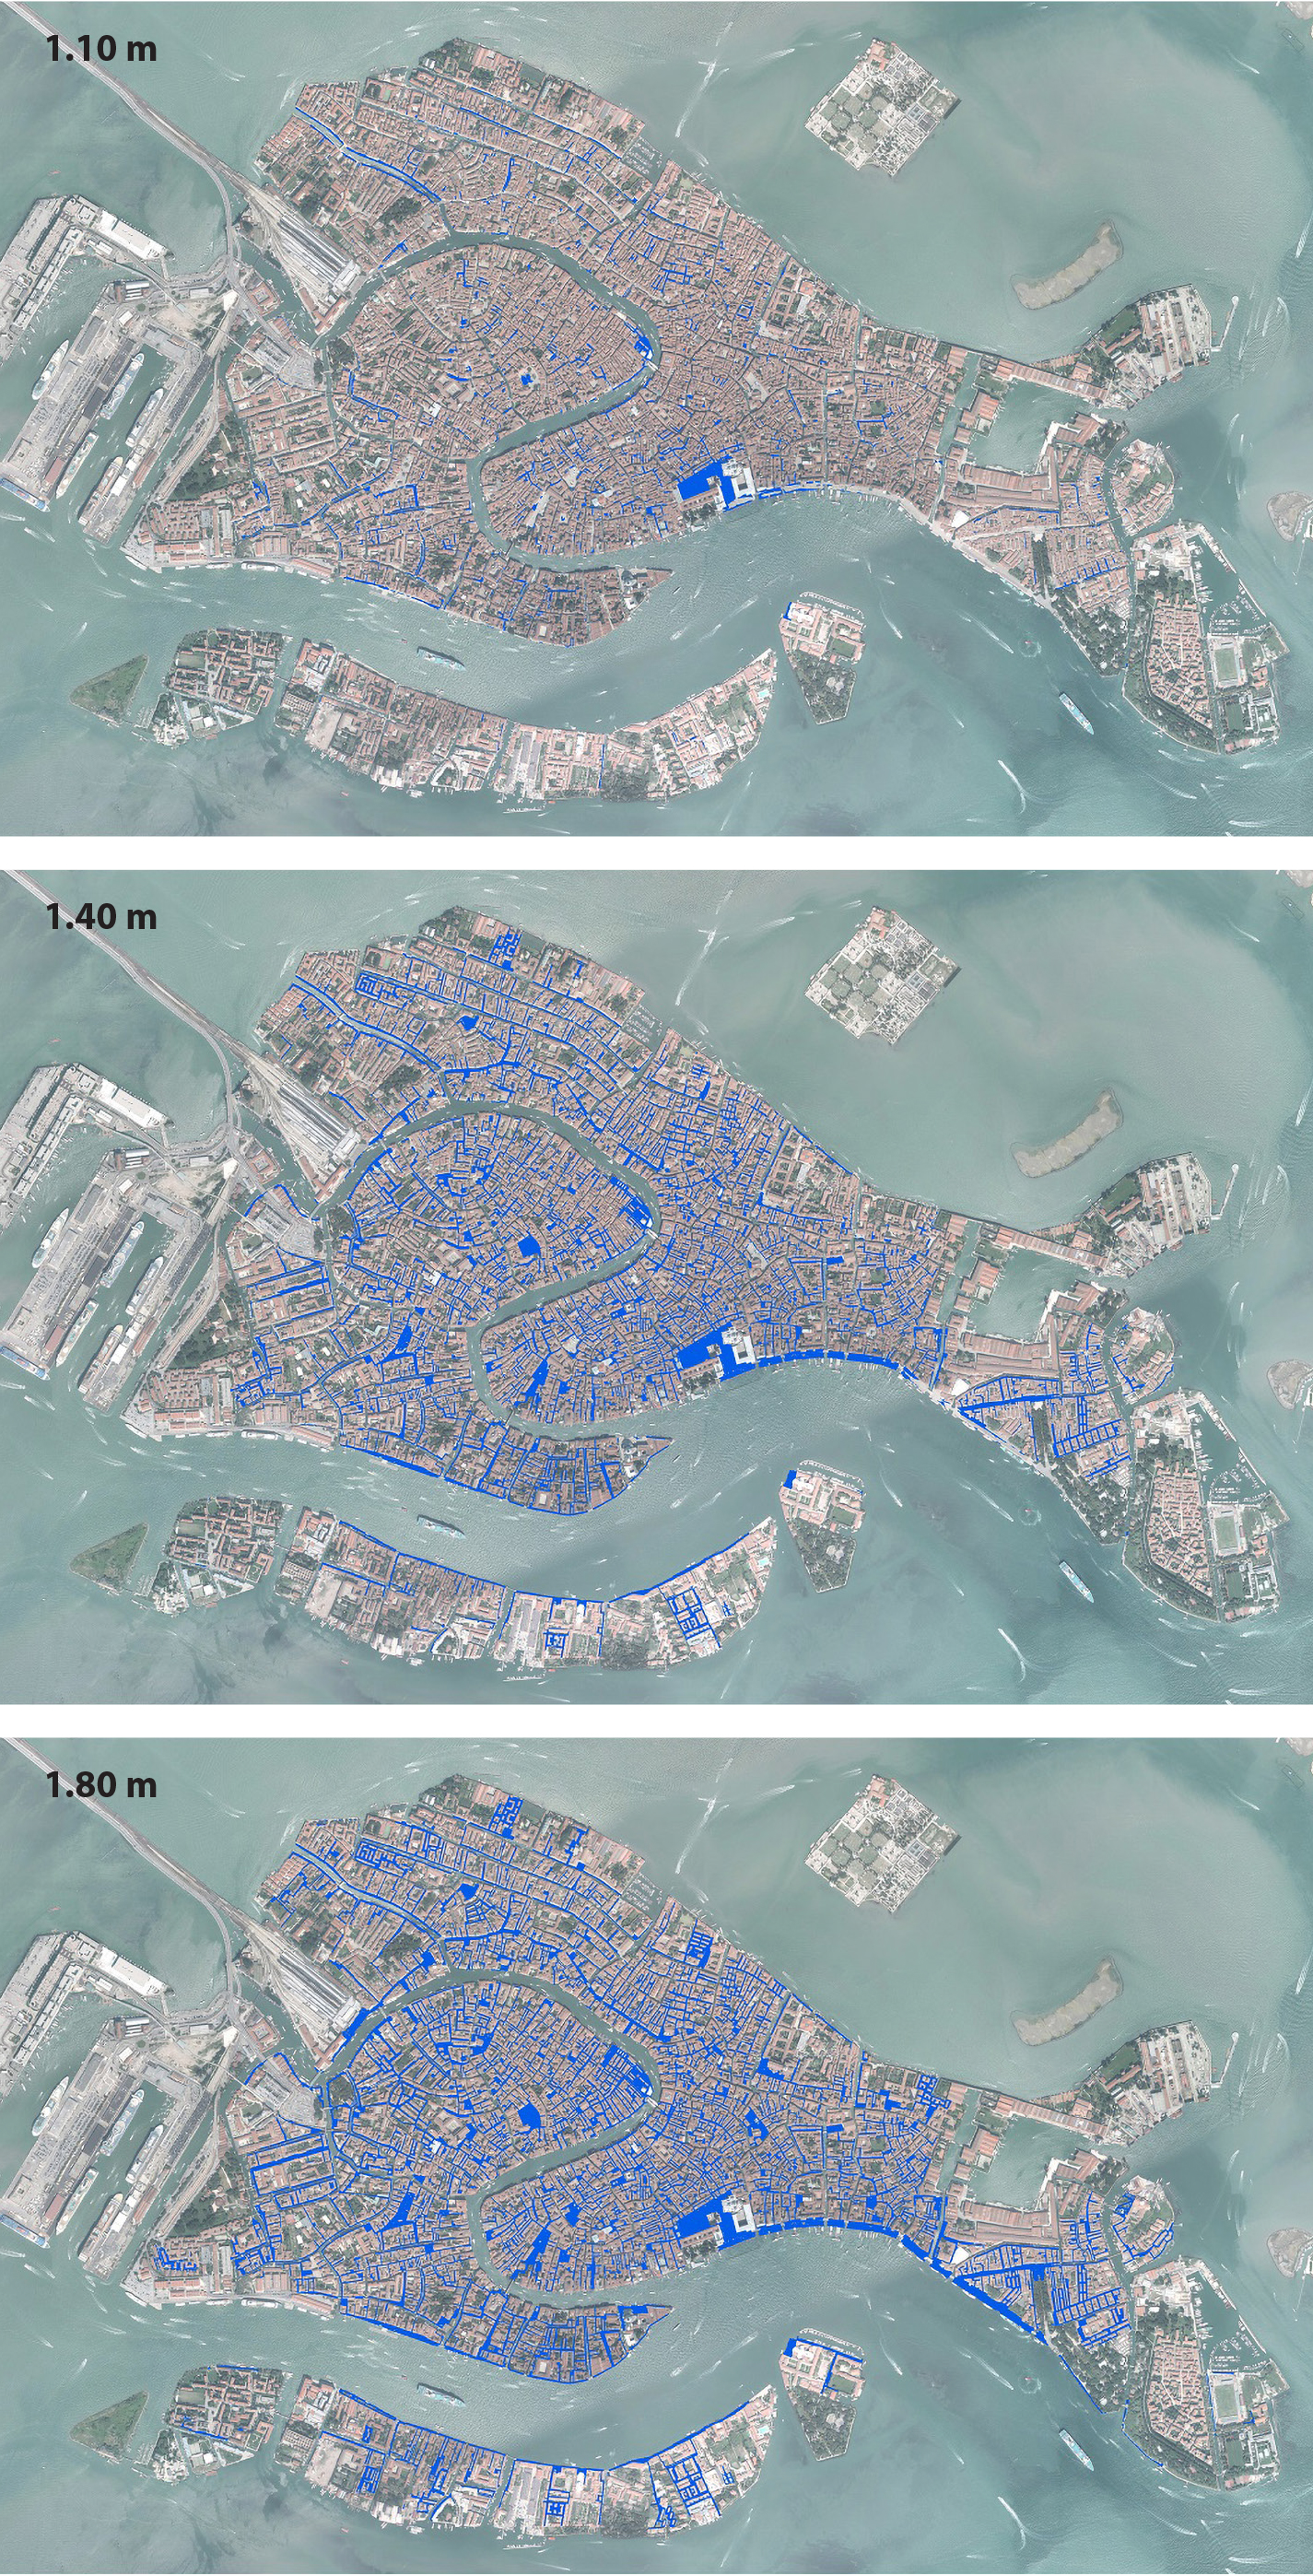
Appendix A. The maps show the areas of Venice flooded at three different sea levels: 1.10 m, 1.40 m, and 1.80 m. > High res image
|


