
Full Text
Variations in Earth’s orbit affect incoming solar radiation and have guided past glacial-interglacial oscillations. These rhythmic changes in insolation are known as Milankovitch cycles. Approximately 900,000 years ago, Earth’s climate pacemaker skipped a beat and switched from the 41,000-year obliquity (Earth’s axial tilt) pacing of the Early Pleistocene to ~100,000-year eccentricity (circularity of Earth’s orbit around the sun) pacing of the Late Pleistocene. This glacial-to-interglacial shift, called the Mid-Pleistocene Transition (MPT), remains one of the most enduring mysteries of the Quaternary and in the field of paleoceanography. Recent reconstructions of atmospheric and oceanic processes and studies of the dynamic linkages between them have paved the way for a more detailed mechanistic understanding of this climatic transition and of Earth’s climate system at large.
Advances in geochemical techniques applied to studies of ocean sediment cores recovered by scientific ocean drilling enable reconstruction of higher-resolution paleoclimatic records of atmospheric CO2, ocean remineralized carbon content, ocean circulation change, and ice volume. We now understand that the characteristic timescales of glacial-interglacial variability are primarily linked to dynamical processes modulated by the ocean and its interaction with ice sheets—in particular, we understand much more about the Southern Ocean’s role in moderating Earth’s climate and its characteristic beats.
The MPT occurred in at least two steps (Figures 1 and 2). The first was the “900 kyr event” around Marine Isotope Stage1 (MIS) 22, when the quasi-eccentricity signal emerged. The second was MIS 16 when the transition was complete. The first step had the largest impact on ocean carbon cycling and (likely) on atmospheric carbon. The Early Pleistocene had symmetrical ice age cycles and a glacial-to-interglacial atmospheric CO2 of ~240–285 μatm (Yan et al., 2019, and references within). Between MIS 22 and MIS 16, there were weak interglacial and increasingly severe glacial periods. At MIS 16, the strong glacial periods of the Late Pleistocene emerged, and after MIS 12, glacial-to-interglacial atmospheric CO2 ranged from ~200 μatm to 280 μatm.
|
|
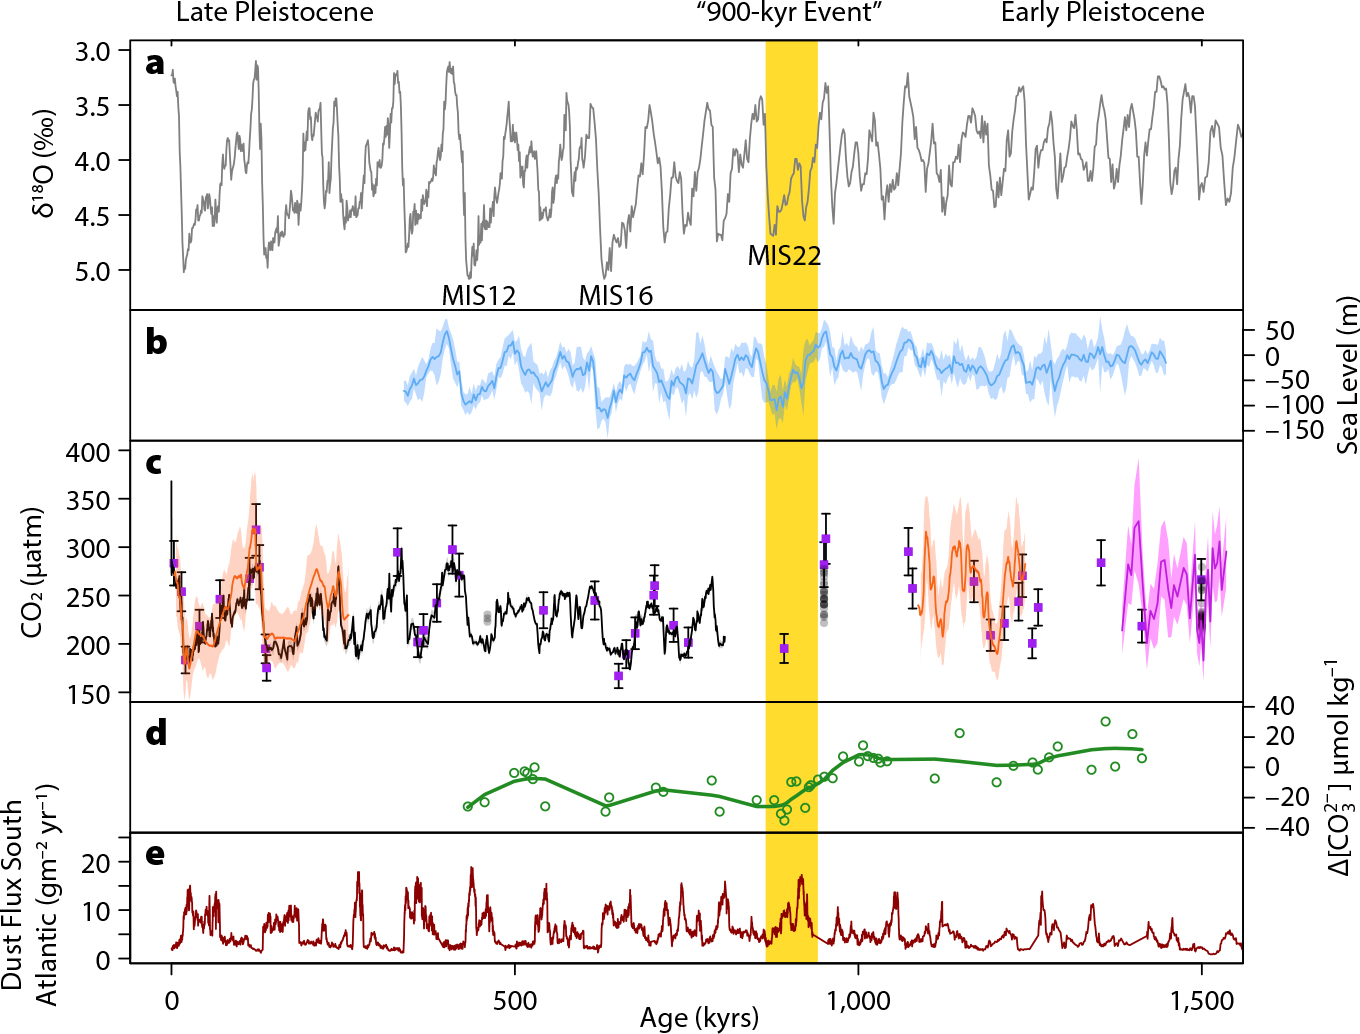
The role of CO2 as a driving mechanism for the MPT is debated, largely due to the absence of a continuous high-resolution record over the transition. Within the next few years, ice drilling in Antarctica may yield some of Earth’s oldest ice, with potential for recovering a continuous record of ancient atmospheric composition back to 1.5 million years ago (Dahl-Jensen, 2018). Nevertheless, existing high-resolution atmospheric CO2 snapshots before, during, and after the MPT suggest that a combination of ocean and ice sheet dynamics controls atmospheric CO2 cycles (e.g., Chalk et al., 2017).
|
|
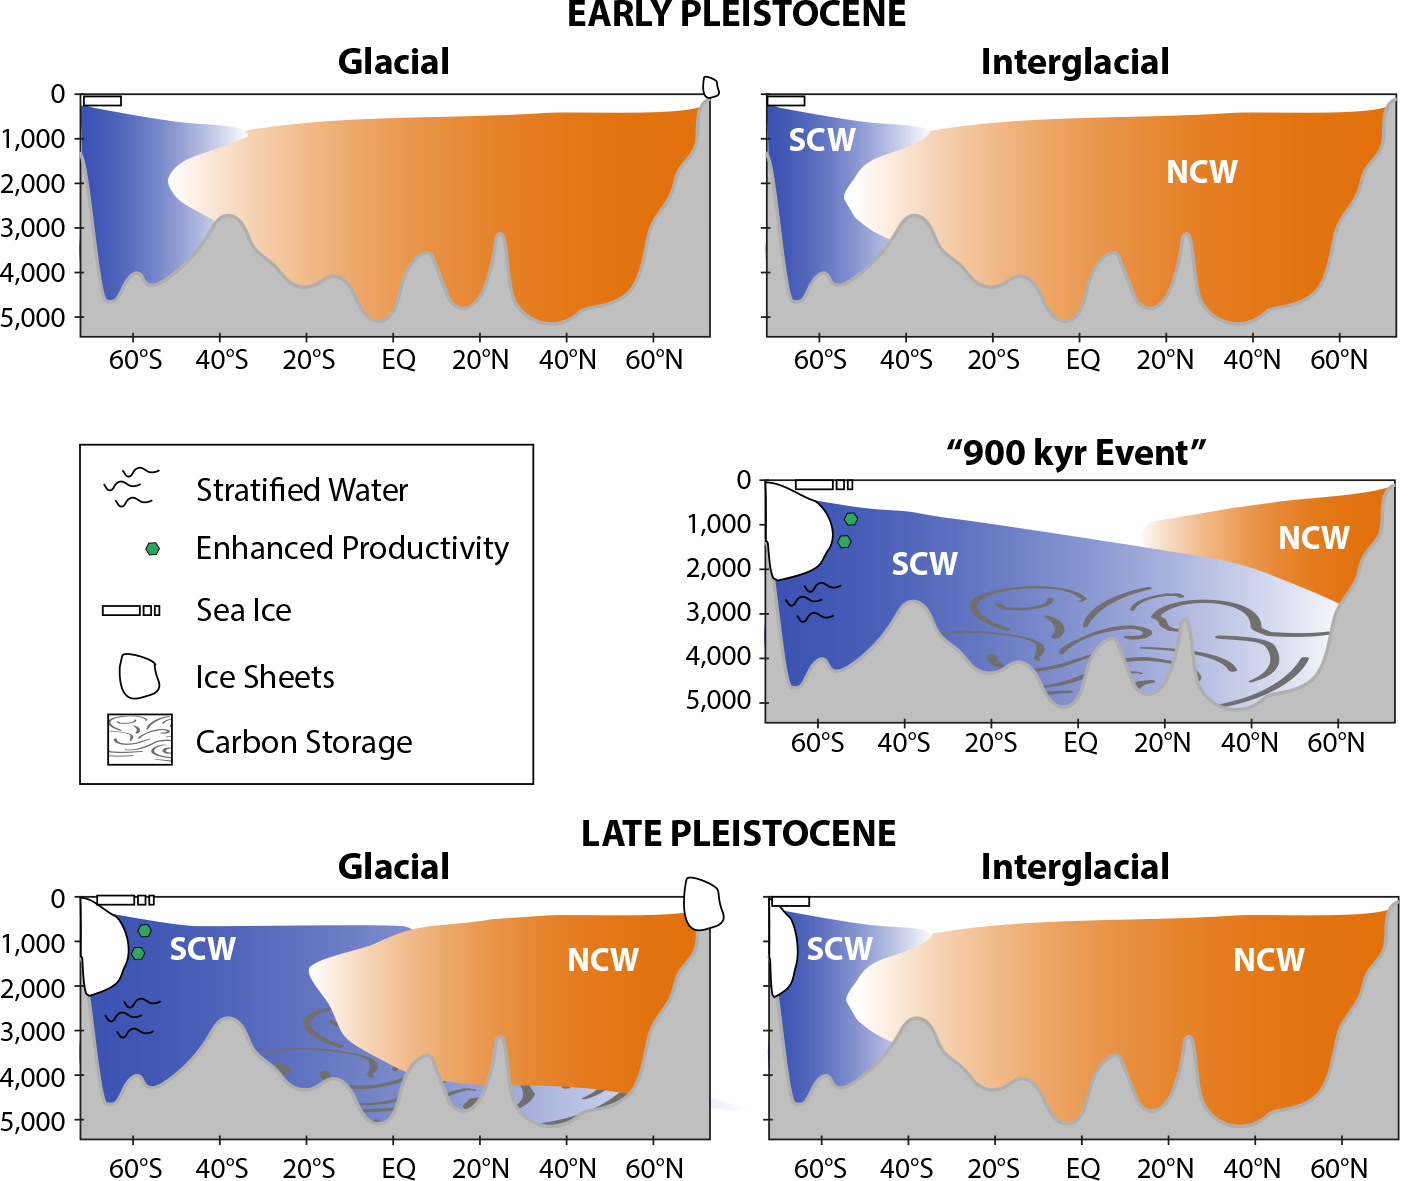
Ocean dynamics played an increasingly important role in sequestering carbon in the deep ocean over the MPT, particularly during the glacial intervals. Neodymium isotopes and benthic foraminifera δ13C, which are used as water mass tracers, show that intermediate- to deep-ocean circulation reorganized between MIS 25 and MIS 21 (Pena and Goldstein, 2014; Ford et al., 2016). Prior to the MPT, deep water formed in the polar north extended toward southern subpolar latitudes during glacial and interglacial periods. During the 900 kyr event, southern-sourced deep water flooded the Atlantic, and its spatial range continued to be extensive during subsequent glacial intervals. This southern-sourced deep water is carbon-rich and has low carbonate ion values (e.g., more acidic, higher carbon content water; Farmer et al., 2019, and references within) and increased the deep ocean carbon reservoir.
In addition to changing the geometry of major water masses, enhanced biological production changed the carbon content of the water subducting into the ocean’s interior from the Southern Ocean, effectively sequestering more carbon in the global deep ocean. During the early stages of the MPT, the amount of iron-bearing dust supplied to the Southern Ocean began to increase (Figure 1), particularly during ice ages (Martínez-Garcia et al., 2011). This iron fertilized the Southern Ocean, increased biological productivity and biological pump efficiency, and contributed to the drawdown of CO2 (Chalk et al., 2017).
The triggers for these alterations in Southern Ocean circulation and biological dynamics remain unknown. A Southern Hemisphere insolation minimum around the 900 kyr event points toward an Antarctic trigger that allowed sea ice to expand. Raymo et al. (2006) hypothesized that Antarctica’s ice sheets transformed from terrestrial-based to marine-based at this time, though there is little physical evidence to support this. Changes in sea ice and ice sheet margins would have altered the freshwater balance of the Southern Ocean, strengthened water-column stratification, and contributed to sequestration of carbon into the ocean’s interior (Hasenfratz et al., 2019).
Deciphering when, where, and how much ice volume growth occurred over the MPT from benthic δ18O records is difficult. An individual record reflects the regional signal from where deep waters are formed (temperature and evaporation and precipitation processes that are imprinted in the δ18O of seawater), the circulation history of the water mass, and the global signal of both temperature and ice volume. Lisiecki and Raymo’s (2005) original “LR04 stack” (updated by Ahn et al., 2017) was revolutionary because these regional imprints were largely “averaged out,” allowing them to create a global picture of temperature and ice volume over the last few million years (Figure 1). The question of where ice volume increased can only be inferred, even in a benthic stack.
Isolating δ18O of seawater is crucial for reconstructing changes in global ice volume over the MPT. The δ18O of benthic foraminifera calcite reflects both the temperature and δ18O of seawater in which the calcite formed. The magnesium-to-calcium ratio of benthic foraminifera calcite can be used to independently constrain temperature so that the δ18O of seawater can be teased apart. Although early interpretations from individual sediment cores were complicated by changes in ocean circulation, a recent stack of δ18O of seawater that includes North Atlantic, South Pacific, and North Pacific sites aims to construct a global picture of ice volume change (Ford and Raymo, 2020). It shows that ice volume grew during both MIS 22 and MIS 16 (Figure 1), though we don’t know the precise location of this ice. Given the Southern Hemisphere insolation minimum during the 900 kyr event, ice volume growth likely occurred in Antarctica during MIS 22 and consequently increased the sensitivity to the 100 kyr cycle through hemispheric phase locking (Raymo and Huybers, 2008). Ice volume growth during MIS 16 likely had Northern Hemisphere origins, possibly related to Laurentian regolith removal and ice sheet stability (Clark and Pollard, 1998), and this growth completed the transition.
The MPT is a prime example of a gradual climate transition whereby small, additive changes in Earth’s internal climate dynamics can force a large response, and the transition occurs with relatively minor changes to average CO2 levels (less than 20 year’s average at current rates of anthropogenic emissions) and with no apparent changes to the structure of orbital parameters that have governed much of Cenozoic climate change. Studying exactly how these changes were triggered and how they interact with one another is going to be crucial as we enter the next phase of human-caused climate change.
1 Marine isotope stages are alternating warm and cool periods in Earth history deduced from oxygen isotope ratios of fossil benthic foraminifera shells recovered from deep-sea sediments. Even numbers represent cold glacial periods and odd numbers represent warmer interglacial periods. MIS 1 is the present day.