Background
Marine net community production (NCP; i.e., photosynthesis minus respiration) is a critical ecological variable that constrains the ocean’s capacity for biomass production and carbon export via the biological pump. Ocean metabolism is reflected in surface O2 variability, such that NCP can be estimated from in situ O2 measurements obtained along ship tracks, at fixed sites, and on autonomous profilers (e.g., Kaiser et al., 2005; Emerson et al., 2008; Yang et al., 2017). However, physical processes, including temperature-dependent solubility changes and bubble injection, also influence O2 budgets, and these effects can bias NCP estimates. For this reason, underway ship-based measurements of biological O2 saturation anomalies (ΔO2/Ar) have become increasingly common as tracers of mixed-layer NCP, where argon (Ar) is a biologically inert O2 analog that corrects for physically induced changes in gas saturation states (Craig and Hayward, 1987).
Presently, underway measurements of ΔO2/Ar are obtained using ship-based mass spectrometry, and this technique has yielded many important data sets. Yet, these instruments may be cost-prohibitive for some researchers and require significant power and operator oversight, making mass spectrometry poorly suited for long-term data collection without significant support infrastructure. This limits the capacity for truly autonomous NCP derivation from underway platforms and volunteer observing ships (VOS). Recent technological advances in O2 optodes and gas tension devices (GTDs; Tengberg et al., 2006; Reed et al., 2018) have enabled high-resolution, unattended measurements of seawater O2 and N2 (McNeil et al., 2005). Ongoing work by our group has evaluated the potential to estimate NCP from O2/N2 ratios (i.e., ΔO2/N2) in a manner analogous to ΔO2/Ar (manuscripts in preparation). Although the solubility properties of N2 and O2 somewhat differ, and N2 is subject to minor biological influences (e.g., N2-fixation), ΔO2/N2 approximates ΔO2/Ar under many conditions. Oxygen and N2 measurements have been combined to infer gas dynamics (Zhou et al., 2014; Tortell et al., 2015) and NCP from refined O2 budgets (Emerson et al., 2019), but NCP derivation from underway ΔO2/N2 remains largely underexploited. The development of a robust system for continuous O2/N2 measurement thus has the potential to significantly expand oceanic NCP estimates.
In this article, we describe a system for autonomous, flow-through O2/N2 measurements. We provide an overview of this system, named PIGI (Pressure of In situ Gases Instrument), with validation results from field deployments and laboratory testing, followed by recommendations for successful field use. Detailed assembly, deployment, and data processing instructions are available in the online supplementary materials.
System Overview
The PIGI is an autonomous measurement system consisting of an electronics box and a flow-through wet box connected to a continuous seawater supply. The wet box (Figure 1) comprises a primary chamber (~600 mL) containing a custom-built buoyancy-driven debubbler and an instrument loop containing an Aanderaa Data Instruments Optode 4330 (standard sensing foil) and a Pro-Oceanus Systems Inc. mini-TDGP (total dissolved gas pressure) GTD. Seawater entering the system from the ship’s supply first passes through the debubbler to minimize measurement contamination by trapped air. Bubble-free water is then pulled from the primary chamber and past the gas sensors using a centrifugal pump installed downstream of the instruments.
In the instrument loop, seawater first passes the GTD sensing membrane through a manufacturer-supplied plenum before entering a flow-through cell (~250 mL) containing the optode. Best results (i.e., reduced data noise and optimal instrument response times) are obtained when seawater flows directly onto the sensing faces. Water exiting both chambers merges to form a single outflow line, and check valves are installed to prevent recirculation or drainage of the centrifugal pump head. Discrete calibration samples can be obtained via a separate line at the outflow of the instrument loop. Flow measurements from both chambers facilitate system monitoring and quality control. Flow rates through the instrument loop should be held constant within 10% of a nominal value, with target rates of ~1.5–3 L min–1 providing optimal data quality.
The wet box components can be mounted directly onto a wall or grating (Figure 1c) or installed on a baseplate secured within a Pelican case (Figure 1b) for protection and easy transport. In either configuration, the system can be disassembled for easy cleaning (see supplemental video) and should be oriented vertically (intake at bottom) so that entrained bubbles escape via the top of the primary chamber (Figure 1a).
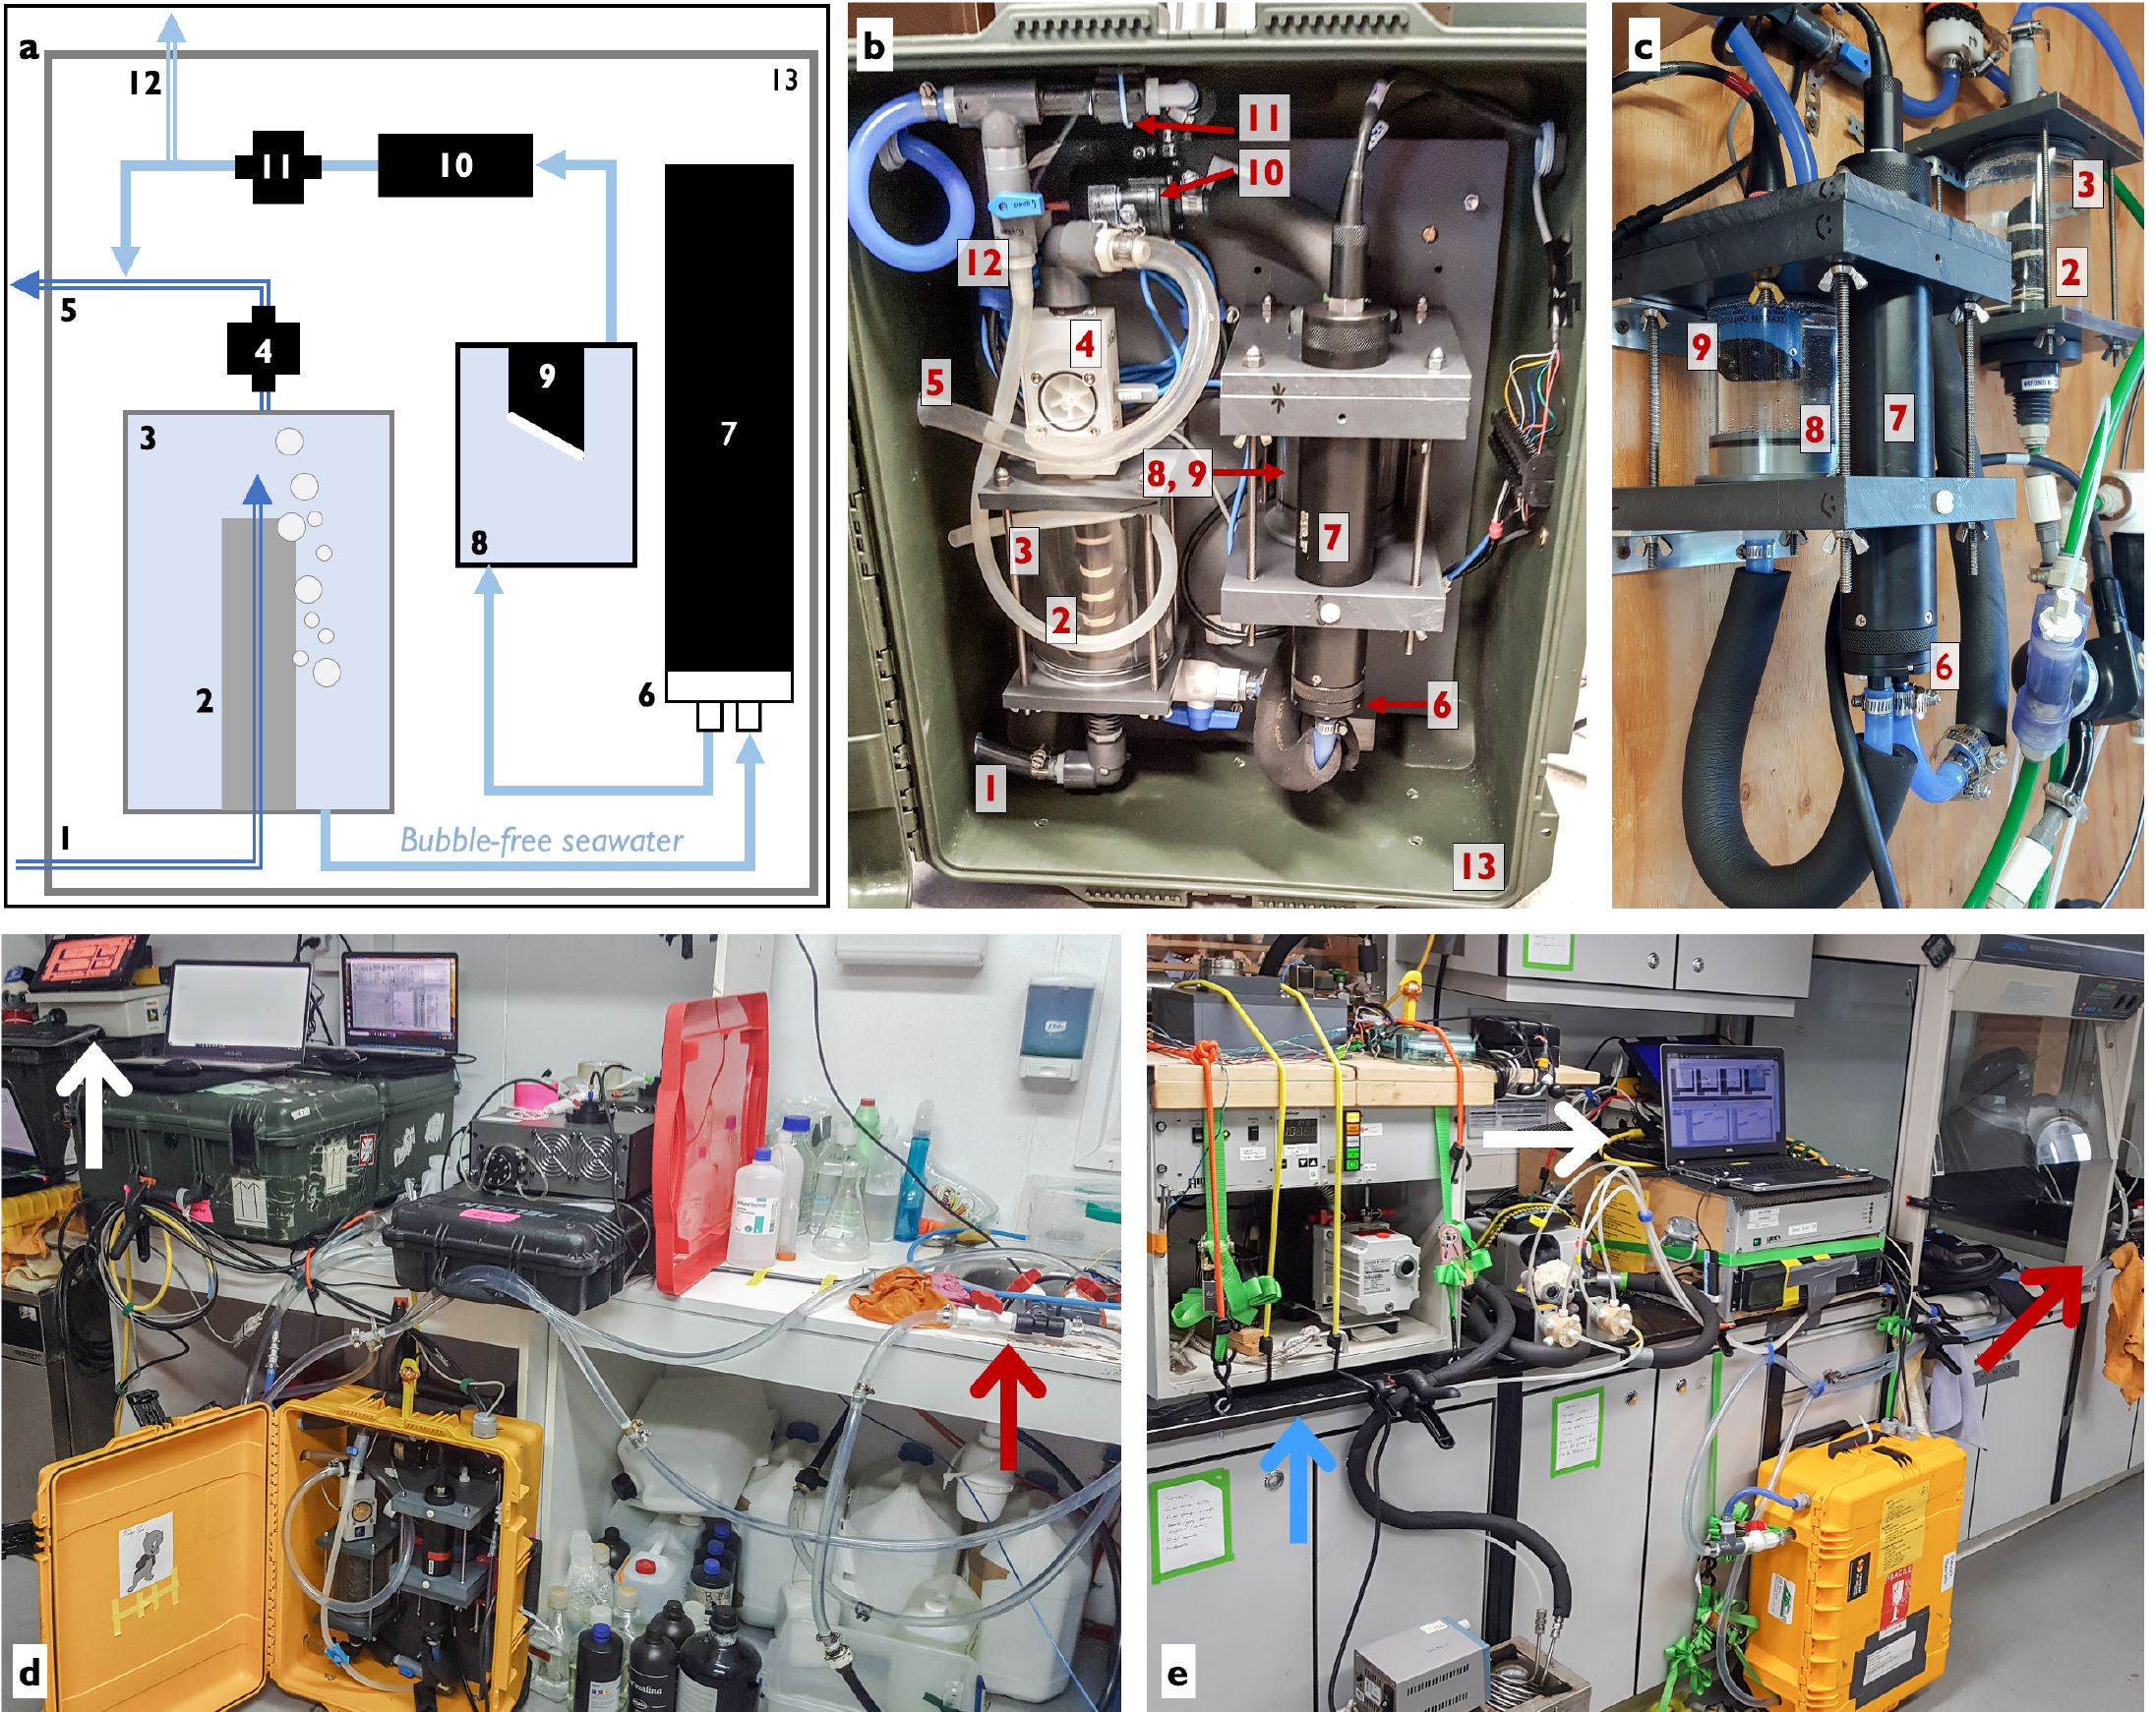
Figure 1. A schematic (a) and photographs (b–e) of the flow-through Pressure of In situ Gases Instrument (PIGI) system. Panels (b), (d), and (e) show the system installed in a Pelican case, while (c) shows a wall-mounted version at the Hakai Institute’s Quadra Island Ecological Observatory. Seawater flow paths are represented by blue lines in (a). Labeled parts in (a)–(c) are: system inflow (1), debubbler (2), primary chamber (3), primary chamber flowmeter (4), system outflow (5), TDGP (total dissolved gas pressure)-mini plenum (6), TDGP-mini GTD (gas tension device) (7), optode chamber (8), optode (sensing foil shown in white) (9), centrifugal pump (10), instruments flowmeter (11), discrete sampling line (12), and Pelican case (13). Not all components are shown in (c). PIGI deployments at Base Prat, Antarctica, and on CCGS Amundsen are shown in (d) and (e), respectively. The white and red arrows show the locations of the electronics box and the seawater supply. The blue arrow in (e) points to a membrane inlet mass spectrometry (MIMS) system. > High res figure
|
The electronics box (Figure S1) runs LabVIEW and AutoIt programs to automate data acquisition and instrument control. AutoIt is used to restart data collection at user-defined intervals. The LabVIEW program (Figure 2) displays and logs data at a frequency of up to 1 Hz and automatically turns off the instrument’s pump to prevent damage during interruptions of seawater flow to the system (e.g., during sea ice blockages). Uncalibrated gas signals (optode O2 and GTD total dissolved gas pressure), ancillary measurements (temperature and flow rates), and raw sensor signals (e.g., optode phase shift) are saved to a continuously updated ASCII file. Deployment metadata and instrument settings are logged separately at the beginning of each acquisition. The LabVIEW program interfaces with the instruments (e.g., turn pump on/off, set sampling rate), acquires ship GPS information, and performs satellite data transmissions during remote deployments with an optional Iridium transducer module. Data acquisition software and post-processing MATLAB scripts (details in the online supplementary materials) are provided at https://github.com/rizett/PIGI_system.
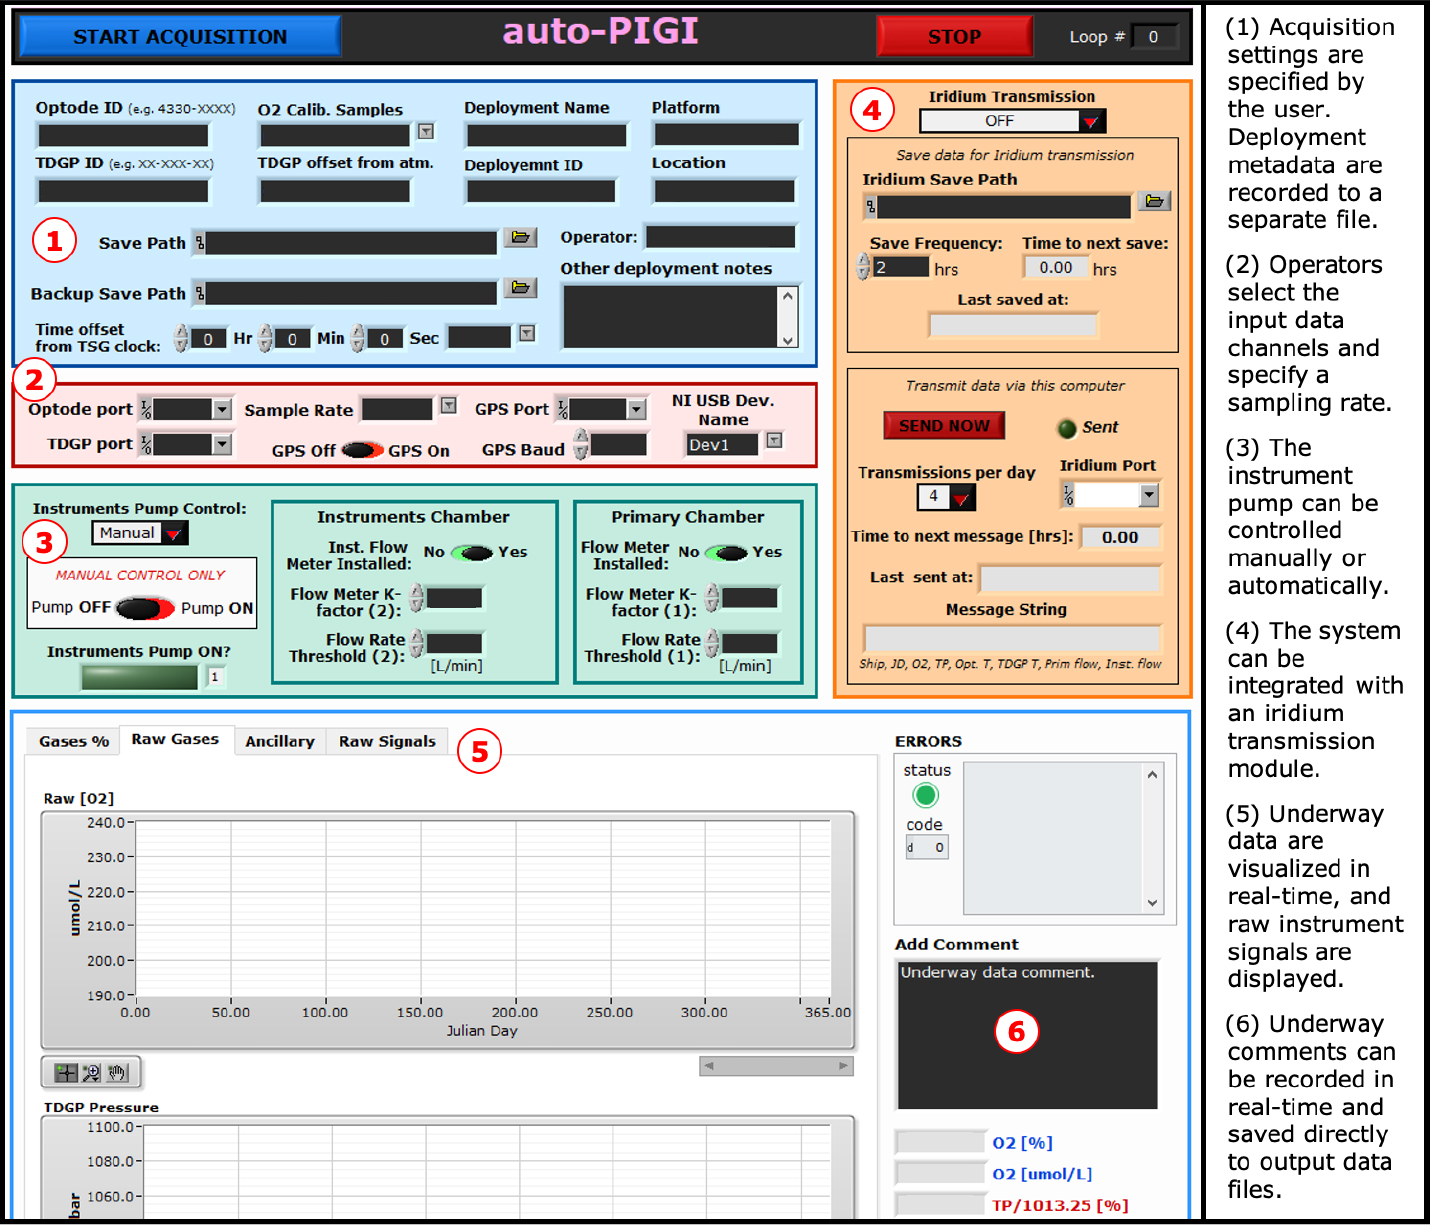
Figure 2. A screenshot of the PIGI LabVIEW interface. Data are displayed in real time in the figure panels, and comments corresponding with observations can be recorded to the data file in real time. > High res figure
|
Materials and Costs
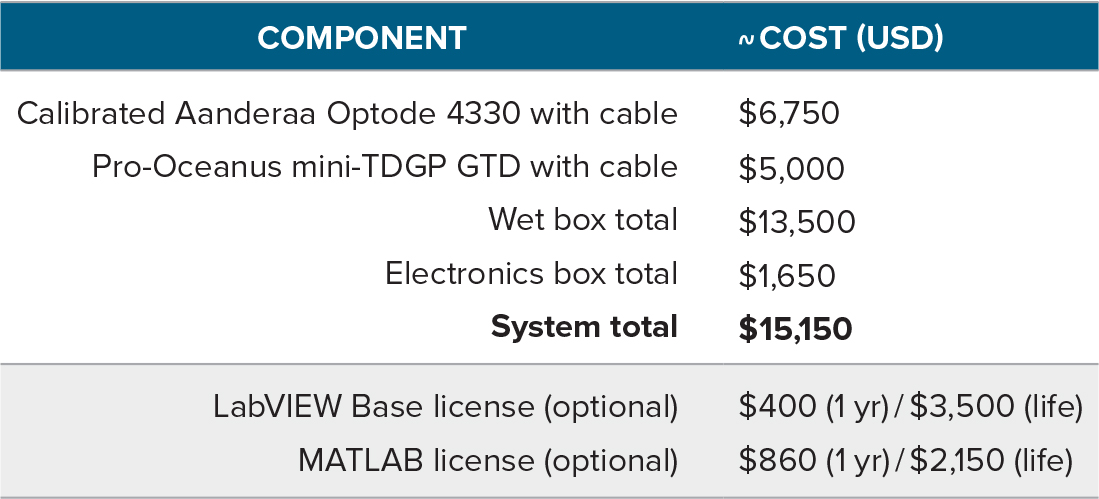
The PIGI system can be constructed from readily available materials with relatively basic knowledge of electronic systems. The components of the flow-through chambers are machined from durable PVC and acrylic. Detailed technical drawings and assembly instructions are provided in the online supplementary materials and at https://seawize.weebly.com/pigi-system.html (refer to this website for potential future updates). The electronics box contains an Intel Nuc mini-processor, data acquisition board, DC relays, and power supplies. Table 1 summarizes component expenses, and Table S1 provides a comprehensive parts list (including recommended suppliers). Notably, the cost of the optode and GTD sensors (combined <$12,000 US) is significantly less than the cost of a mass spectrometer.
Our system consists of an Aanderaa Optode 4330 and Pro-Oceanus TDGP-mini, but other sensors, such as units Aanderaa designed for shallow water deployments (e.g., models 4531 or 4835; ~$2,700 and $4,775 US, respectively) or the RBRcoda T.ODO O2 sensor package (~$4,500 US), can be incorporated with only minor adjustments for cost savings. Although users require a LabVIEW license (Table 1) to modify the software we provide, we have also produced a stand-alone version of the data acquisition program that can be used with the free run-time LabVIEW engine (details in the online supplementary materials). Data may also be acquired or processed using alternative open-source software (e.g., Python, Inlino; Haëntjens and Boss, 2020); the online supplementary materials include a description of the workflow required for autonomous operation.
Table 1. Abbreviated list of expenses of the PIGI system. Full details are provided in the online supplementary materials. Costs are based on quotations obtained in June/July 2020 and exclude local taxes, shipping, and machining expenses. The cost of the wet box includes the gas sensors and additional flow-through parts, while the electronics box expenses include a Windows operating system required to run the automation software, which is quoted separately. > High res table
|
Field Applications and Laboratory and In Situ Testing
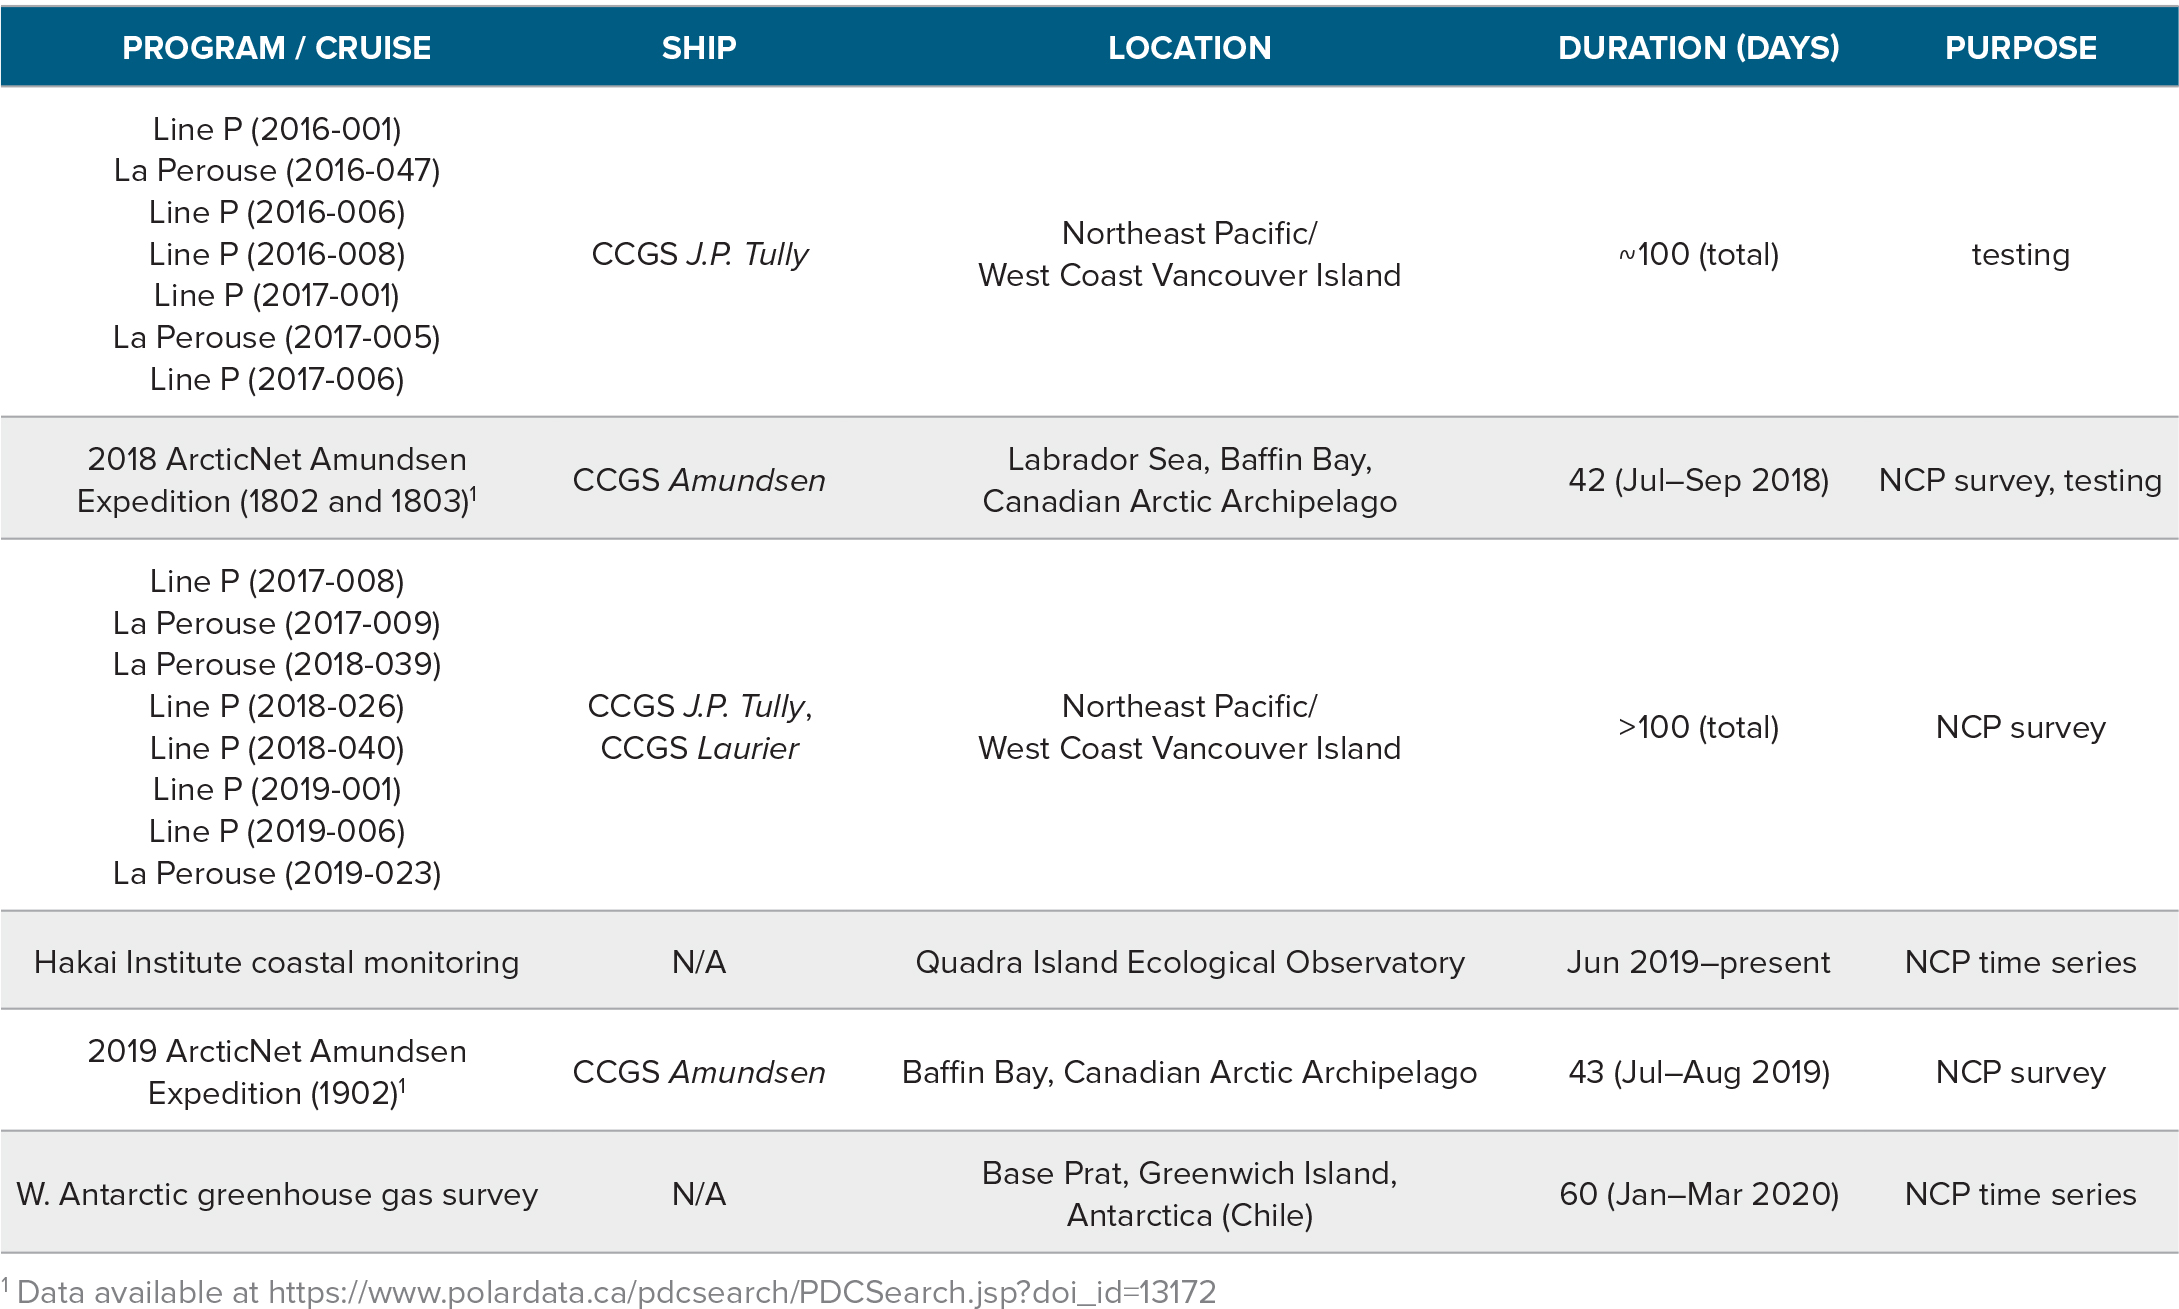
Various iterations of the PIGI system have been tested on 19 field deployments since 2016 (Table 2). Our system has been deployed frequently on La Perouse and Line P cruises in the subarctic Northeast Pacific, while a second unit has collected data continuously at the Hakai Institute’s Quadra Island Ecological Observatory (in British Columbia’s Discovery Islands) for over a year (Figure 1). We have deployed a third system throughout the Canadian Arctic and at a coastal station in Antarctica. A fourth unit will be deployed on a 2021–2022 R/V Tara expedition.
Table 2. List of PIGI system deployments between 2016 and present. Cruise IDs are included, where available, in the first column. NCP = net community production. > High res table
|
During field deployments, the system was evaluated for underway data accuracy, ease-of-use, and integration with existing instrumentation. Salinity-compensated optode O2 measurements (see below) were calibrated using discrete samples obtained from the PIGI sampling line (Figure 1) or surface rosette bottles, and analyzed by Winkler titration. We observed linear relationships between sensor and discrete O2, with offsets in the uncalibrated data typical of Aanderaa optodes whose accuracy decays over time (Bittig et al., 2018). The strong linearity between sensor and discrete data enables calibration with an average accuracy of 1%, which is required for successful field deployments (Emerson et al., 2019). Optode and GTD-derived N2 also showed strong coherence with discrete Niskin bottle samples analyzed by mass spectrometry and could be validated to within ~1.2%. The GTD signal shows significantly less drift than optode measurements, so routine calibration with mass spectrometry samples may not be necessary. These results are consistent across multiple deployments and demonstrate that PIGI measurements are not biased by sampling artifacts. Moreover, GTD pressure measurements on air-equilibrated freshwater circulated through the PIGI trace atmospheric pressure within ~0.1% across multiple instruments and laboratory tests. We thus conclude that our system is able to accurately determine both O2 and N2 concentrations in seawater, provided that necessary calibrations are conducted (see below).
We performed laboratory tests to evaluate PIGI response times by circulating water with contrasting gas compositions (air-equilibrated freshwater and a 1:1 solution of carbonated soda and N2-bubbled deionized water) through the primary and instrument chambers at various temperatures and flow rates (Figure 3c). We determined response times (e-folding time, t63) of O2 and gas tension signals in the PIGI system ranging from ~0.9 min to 1.6 min and 1.0 min to 2.2 min, respectively, based on the time when the water source changed until signals restabilized. These response times are similar to those of a membrane inlet mass spectrometry (MIMS) system used to measure Ο2/Αr (Tortell, 2005), and thus permit observations of small-scale oceanic features (Figures 3c and 4). Notably, the instrument response times are shorter at higher temperatures and faster flow rates (lower range of error bars in Figure 3c).
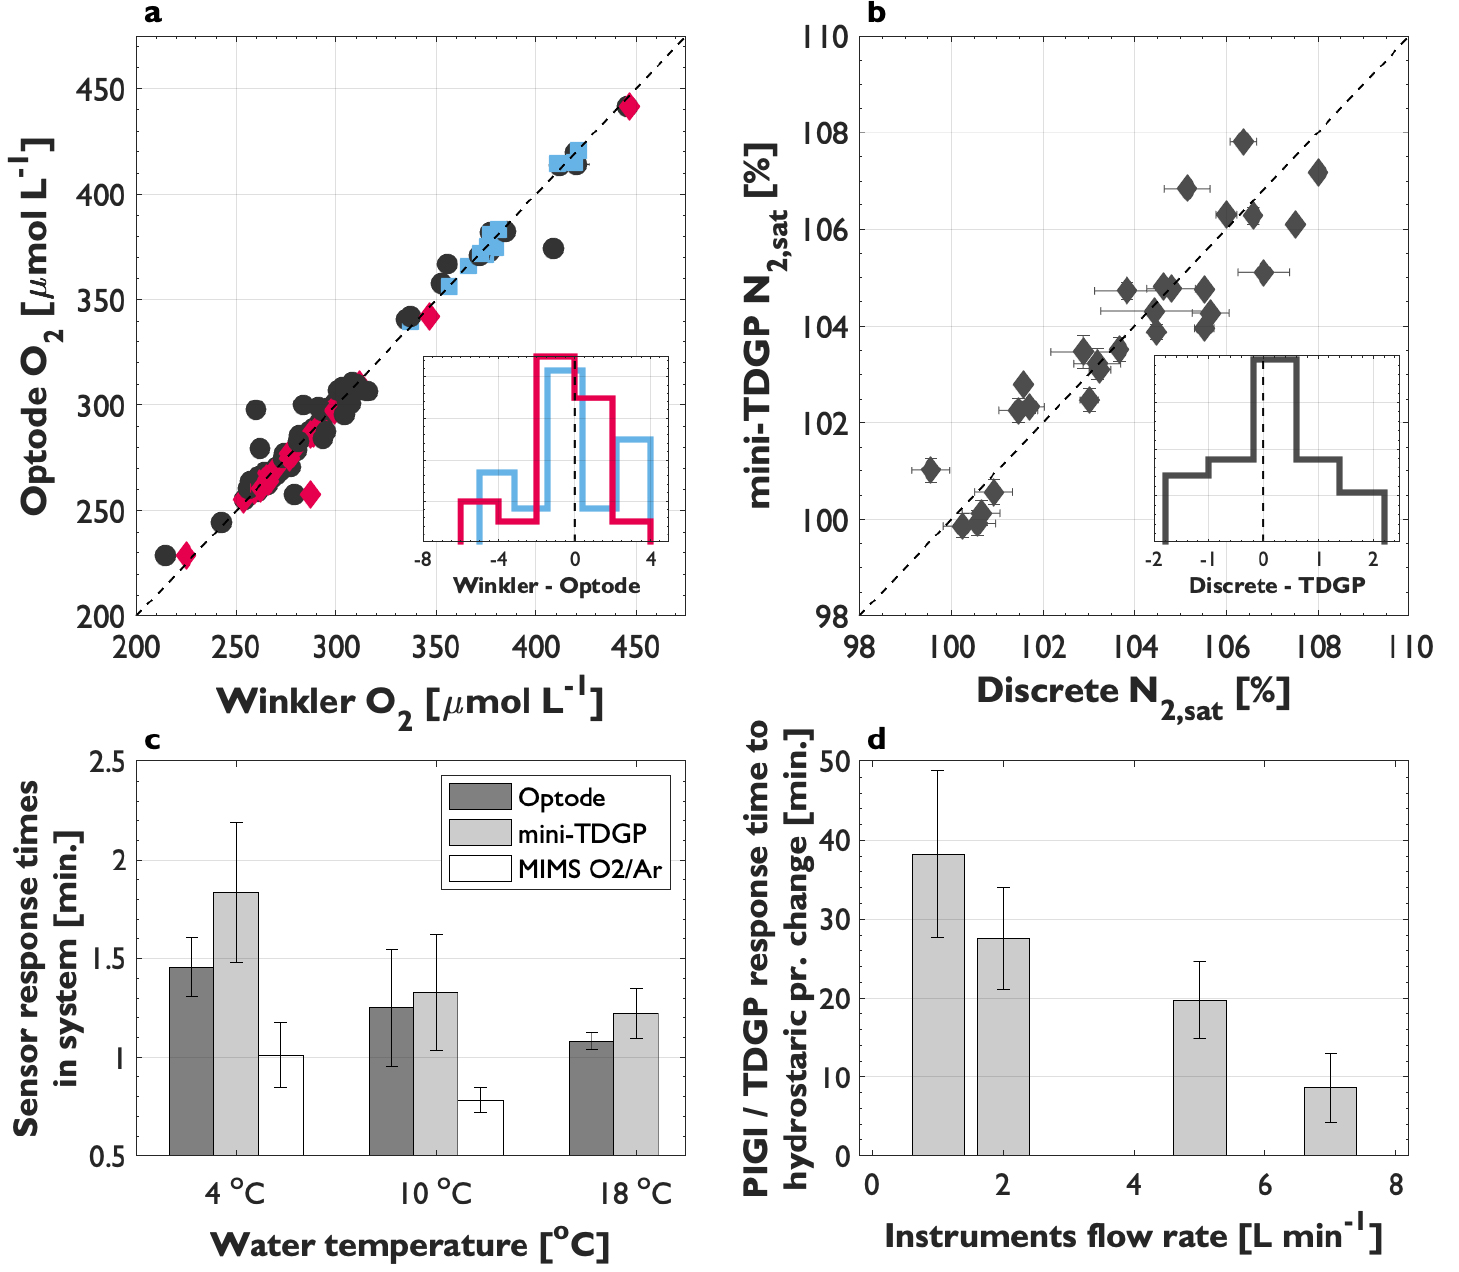
Figure 3. Field validation of PIGI-derived O2 (a) and N2 (b) against discrete samples. Black markers represent samples obtained from Niskin bottles, and colored markers (blue = Arctic; red = Subarctic Northeast Pacific) are for samples obtained from the PIGI system discrete sampling line. Sensor data have been adjusted for offsets using the discrete samples. The insets in (a) and (b) show the residuals between sensor-derived and discrete gas data, with the y-axis representing the proportion of data points. N2 saturation (N2,sat) represents the seawater concentration normalized to the equilibrium concentration at one standard atmosphere. Panel (c) shows the instrument response times in the PIGI system determined in the laboratory as those required for re-equilibration after a change in the inflowing sample water composition. The response time of a MIMS system, determined under the same conditions, is shown for reference. Error bars represent the range of values recorded during repeat experiments and at different instrument flow rates (1–3 L min–1). Panel (d) shows the response time of the mini-TDGP in the PIGI to changes in hydrostatic pressure caused by altering the flow rate through the system. The x-axis corresponds with the flow rate through the instrument chamber during re-equilibration, and error bars represent the standard deviation of values at 4°, 10°, and 18°C. > High res figure
|
The reported response times reflect the time required to flush the wet box chambers and the water residence time within the optode cell. As a result, the optode response in our PIGI system is longer than the manufacturer’s specifications (~25 sec) or values reported in different systems (e.g., Bittig et al., 2014). Despite this difference, the GTD signal, with a response time similar to the manufacture specification of 1.5 min, still lags behind O2 (Figure 4a), so that additional data processing is required when encountering very strong frontal features. Nonetheless, our testing demonstrated that flow rates greater than 1.5 L min–1 through the instrument loop (water residence times <1 and <10 sec within the GTD plenum and optode chamber, respectively) produce high-quality data with good spatial resolution. Increasing the seawater flow rates should further improve instrument response times.
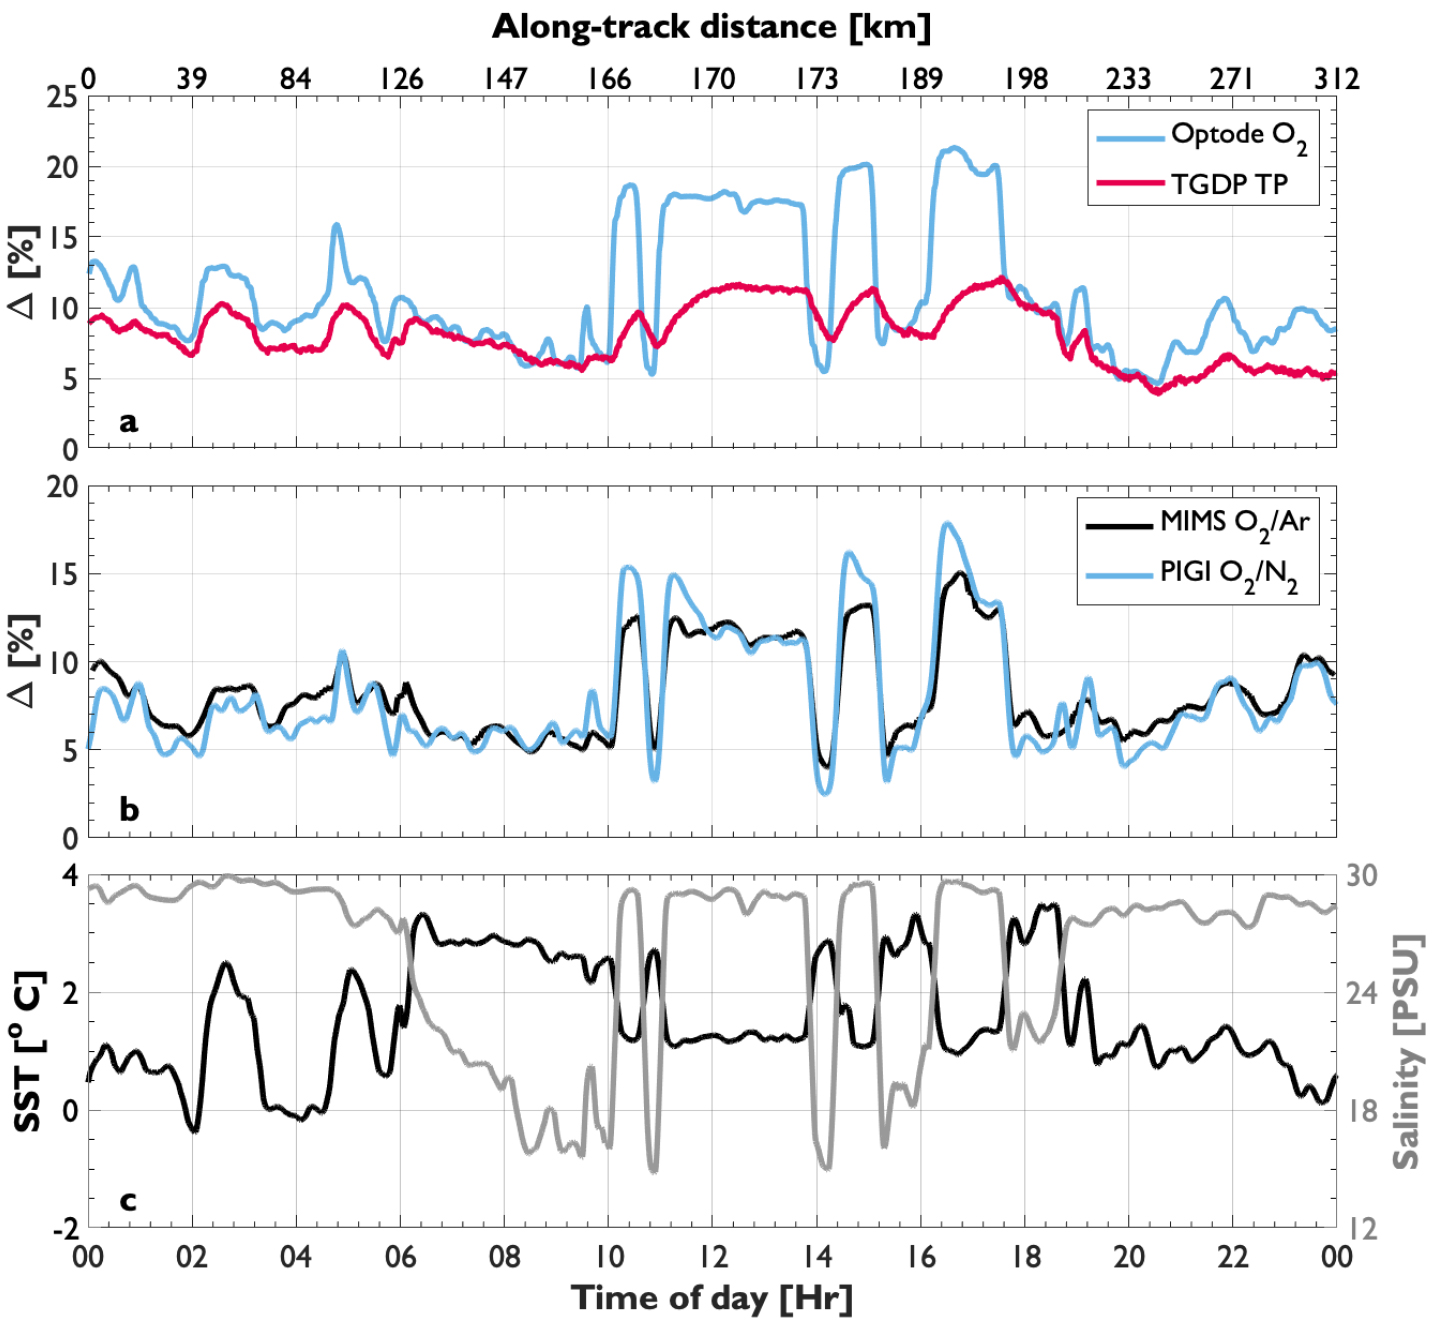
Figure 4. One day of field observations from side-by-side deployments of PIGI and MIMS systems near a fjord in the Canadian Arctic. Panel (a) shows the calibrated optode and GT==D measurements (normalized to the O2 equilibrium concentration at ambient sea level pressure and 1013.25 mbar, respectively), with Pro-Oceanus GTD signals seen to lag behind O2 in strong frontal regions. Derived NCP tracers, ΔO2/N2 and ΔO2/Ar, are presented in (b) and hydrographic data are shown in (c). > High res figure
|
Testing also showed that inclusion of a debubbler significantly reduced data noise and contamination from bubbles entrained in ships’ seawater lines. Bubble effects are particularly problematic during elevated sea states and, to a lesser extent, in calmer conditions if the seawater intake depth is shallow. Commonly used vortex debubblers increase the water residence time in flow-through systems, thereby leading to excess gas dissolution between the seawater intake and the measurement interface. In the PIGI, we thus designed an upward-oriented debubbler that enables rapid escape of bubbles via buoyant rising (Figure 1). The sampling line leading to the optode and the GTD is installed at the bottom of the debubbling chamber so that bubble-free water is drawn toward the sensors. This approach is very effective in diverting bubbles away from the instruments, even during high sea states. Anomalously high O2 and N2 signals can still be measured during elevated sea states, but these result from bubble dissolution in the seawater lines upstream of the PIGI system.
The installation of the pump downstream of the gas sensors and the direction of flow onto the instruments’ sensing faces (Figure 1) are important for minimizing response times and maintaining neutral hydrostatic pressure within the system. Flow rate changes through the instrument loop following pulses in the discharge from the ship’s seawater supply induce hydrostatic effects on GTD measurements analogous to pressure changes during depth profiling (Reed et al., 2018). The PIGI system was designed to minimize these flow-dependent effects and includes flow-rate monitoring for diagnosing such artifacts. Laboratory tests show that GTD response times following such disturbances range between ~10 min and 1 hr, depending on flow rate (Figure 3d). For this reason, it is important to maintain system flow rates as high and as constant as possible.
We also performed side-by-side field deployments of PIGI and MIMS systems (Figure 1e). The results (Figure 4) demonstrate strong coherence between ΔO2/N2 and ΔO2/Ar across small-scale hydrographic frontal features in Canadian Arctic waters. Offsets between the NCP tracers result from the relatively slow GTD signal and from the slightly different solubility properties of N2 and Ar. These offsets can be minimized, however, through simple time-response corrections on underway signals (e.g., Bittig et al., 2014; Hamme et al., 2015) and careful evaluation of physical contributions to excess N2 saturation (manuscript in preparation; Tortell et al., 2015). These results show significant promise for the widespread application of PIGI systems to increase spatial coverage of NCP estimates.
Recommendations and Future Modifications
Throughout system development and testing, we made modifications to PIGI hardware and software to improve overall performance and ease of deployment. Based on our field and laboratory testing of previous versions of the system, we find that the present configuration maximizes data quality. Importantly, the PIGI was designed for unattended use by operators with little or no previous experience with the relevant instruments. We suggest that future deployments of optode/GTD systems follow similar principles to those discussed here, while considering several recommendations for additional improvements.
Accurate quantification of NCP from O2/N2 measurement systems requires ancillary temperature and salinity (T/S) data sets and O2 calibrations to achieve a desired accuracy of 1%. The latter can be achieved through Winkler analyses on discrete seawater samples or in-air measurements following the approach used on biogeochemical Argo floats (Bittig and Körtzinger, 2015). Nitrogen derivation relies on accurate O2 and GTD pressure observations, which can be calibrated from in-air measurements made prior to and following deployments. Future PIGI designs may incorporate an air-pumping system (Bushinsky and Emerson, 2013), so that air-based calibrations could be performed during deployments.
Moreover, T/S data are necessary for performing post-processing calculations on PIGI measurements, including O2 salinity compensation and the determination of gas partial pressures (details in the online supplementary materials). While optodes include a temperature sensor, salinity measurements must be obtained from separate sensors. If T/S measurements are not made elsewhere on the deployment platform, a salinity sensor can be incorporated in the PIGI instrument loop.
Future systems may also benefit from a smaller optode chamber, which would decrease the optode response time (at a given flow rate) by reducing the optode chamber flushing time. We note, however, that the response time of the GTD in our system remains most limiting to higher resolution ΔO2/N2 measurements. In addition, seawater should be pumped rapidly through the primary chamber to reduce overall system response times and minimize the impact of potential bubble dissolution. To limit hydrostatic pressure effects on GTD measurements, a flow controller may be installed in the instrument loop. In its absence, a stable flow rate through the instrument loop should be measured and maintained in order to minimize excursions in the GTD data.
Conclusions
We describe an automated, user-friendly optode/GTD system capable of high-resolution and accurate O2/N2 measurements from a continuous seawater supply. The system has been tested and deployed under a wide range of laboratory and oceanographic conditions and has produced high-quality data from deployments on various platforms. Based on insights from these deployments, we provide recommendations for successful PIGI operation and include detailed designs for the system hardware and software in the online supplementary materials. The system we describe here may be deployed on research vessels and voluntary observing ships or at land-based field stations with a continuous seawater supply. Widespread deployment of the underway PIGI system would lead to a significant expansion of global NCP measurements, providing better understanding of large-scale oceanic responses to ongoing climate variability.
Acknowledgments
We would like to thank C. McNeil (University of Washington); R. McCulloch, J. Unger, and D. Lovrity (University of British Columbia); and M. Barry (Pro-Oceanus) for their input on instrument design, testing, and technical support. We thank R. McCulloch, H. Bittig, and one anonymous reviewer for their valuable feedback, and many additional colleagues at DFO Canada, Amundsen Science, Hakai Institute, and INACH (including M. Robert, D. Yelland, C. Manning, W. Burt, Z. Zheng, J. Shiller, T. Venello, A. Timmerman, M. Ahmed, R. Hamme, A. Bourbonnais, W. Evans, K. Pocock, C. Weekes, M. Galbraith, T. Fraser, and M. Belton) for their assistance during field deployments. Funding was provided by NSERC, MEOPAR, and ArcticNet.
Declaration of Interest
We declare that there are no known conflicts of interest associated with this work. We have not received financial support from Aanderaa Data Instruments AS or Pro-Oceanus Systems Inc.