INTRODUCTION
A key organizing principle for the ecosystem of the northern Bering Sea and adjoining southern Chukchi Sea is a strong link in the shallow, seasonally productive waters between spring-summer pelagic production and transfer of that organic matter to the underlying sediments as sea ice retreats (Grebmeier et al., 2015a). Over the last decade, the seasonally variable sea ice cover in this Pacific Arctic region has been retreating earlier and forming later (Frey et al., 2015). Three major water masses influence the northern Bering Sea: Anadyr Water (AW) in the west, characterized by cold, high salinity water, with seasonally high nutrients; Alaska Coastal Water (ACW) to the east, characterized by warmer, less saline water; and Bering Shelf Water (BSW) that occurs between these two water masses, with intermediate seawater temperature and salinity values (Figure 1; Danielson et al., 2017). North of Bering Strait, AW and BSW mix to form Bering Sea Water, while ACW retains its characteristics in the east along the Alaska coast (Danielson et al., 2017). The highest primary production and chlorophyll standing stock occur in the offshore Anadyr Water and Bering Shelf Water (Danielson et al., 2017); the lowest seasonal values of primary production are found in the nearshore Alaska Coastal Water (Cooper et al., 2012; Hill et al., 2018). Recent studies by Danielson et al. (2017) and Giesbecht et al. (2018) in the northern Bering and Chukchi Seas note that phytoplankton biomass and size structure distributions are linked with regional wind fields, seafloor topography, water mass distribution, and pelagic production (e.g., zooplankton), emphasizing the importance of multidisciplinary studies to relate pelagic processes to benthic production.
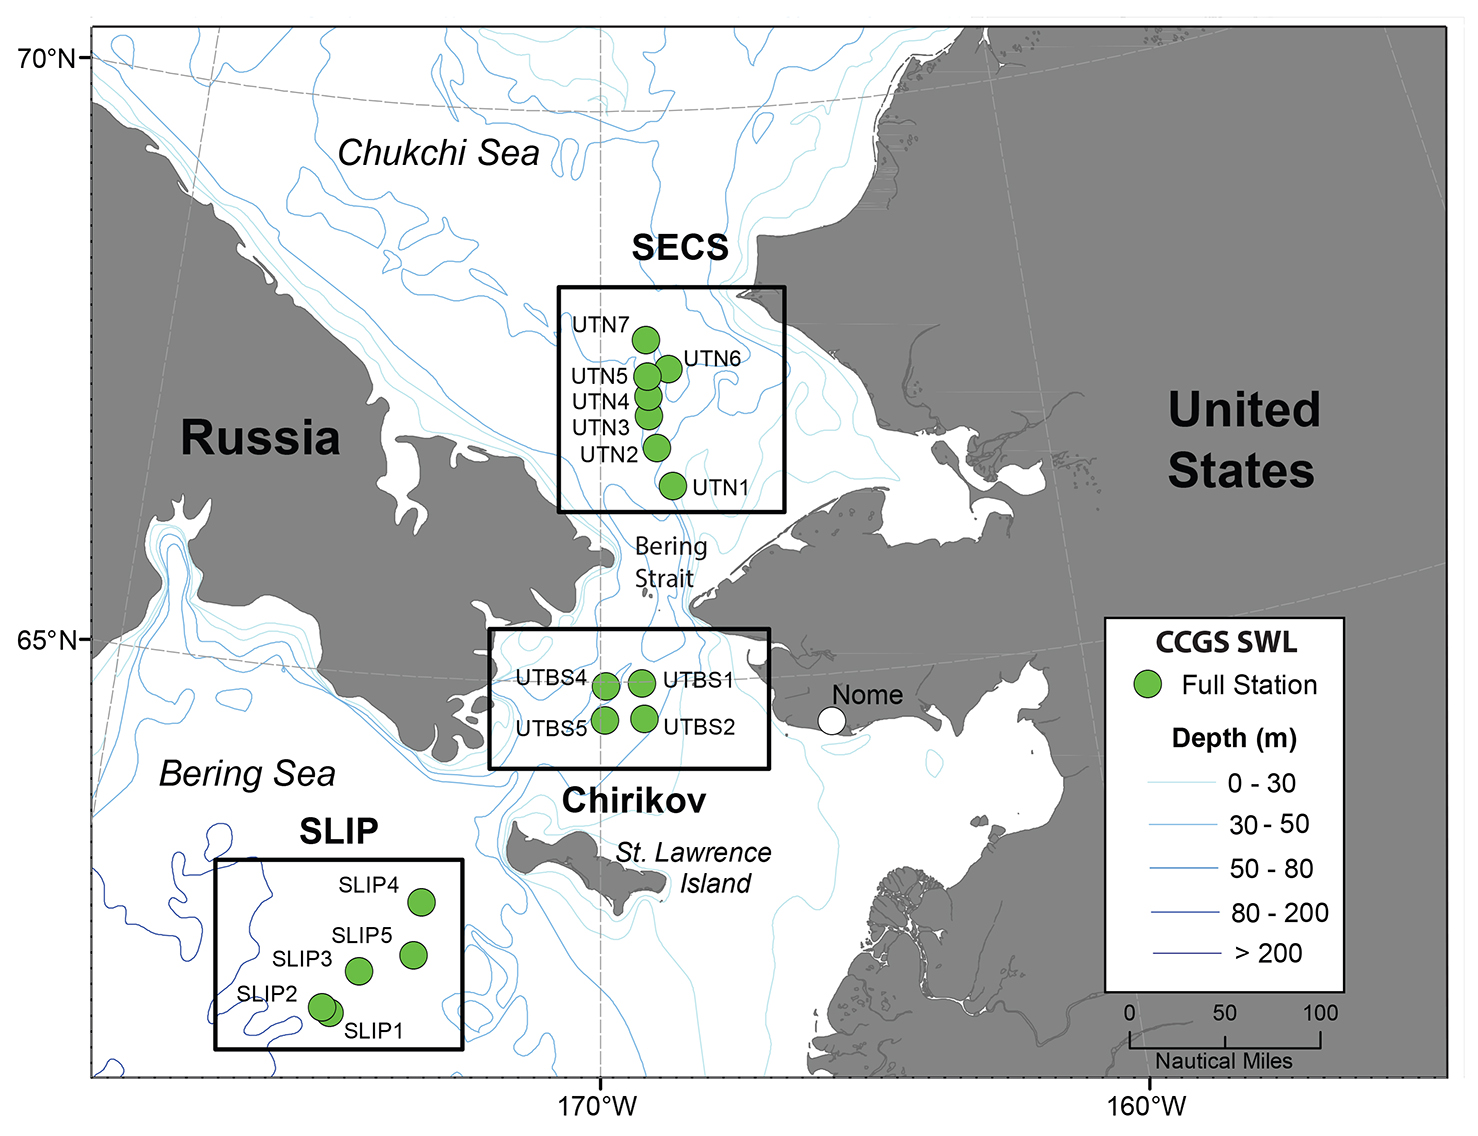
Figure 1. Time series sites occupied annually in July from 1998 to 2015 using the icebreaker CCGS Sir Wilfrid Laurier (SWL). The stations shown are in the following regions and time periods: St. Lawrence Island Polynya (SLIP; stations SLIP1–SLIP5, 2000–2015). Chirikov Basin (Chirikov; stations UTBS1–UTBS4, 1999–2015). Southeast Chukchi Sea (SECS; stations UTN1–UTN7, 1998–2015). > High res figure
|
Many prior studies indicate that warming seawater temperatures can change primary production rates and water column grazing by zooplankton, influencing the phenology (seasonal timing) of pelagic-benthic coupling processes, specifically the export of organic carbon to the benthos (Coyle et al., 2011; Grebmeier et al., 2015a; Renaud et al., 2015). Factors directly related to climate change (sea ice dynamics, ocean mixing, current speed, seawater warming, and ocean acidification) are known to impact benthic community composition in the Atlantic Arctic’s Barents Sea (Hunt et al., 2013) as well as in Pacific Arctic waters (Grebmeier, 2012; Hunt et al., 2016). Renaud et al. (2015) hypothesized that reaching temperature thresholds for some Arctic and boreal benthic fauna could result in contraction of Arctic species and northward expansion of boreal fauna. However, the role of temperature varies depending upon whether it occurs in surface versus bottom water. Although temperature is known to be an important driver for faunal metabolic rates, bottom water temperature is less important for affecting benthic biomass compared to food supply in the northern Bering and Chukchi Seas (Grebmeier et al., 2015a). Seawater warming (Wood et al., 2015; Woodgate, 2018) and shifts in sediment composition and organic carbon content in the Pacific Arctic (Grebmeier et al., 2012, 2015b; Lovvorn et al., 2018) are physical changes that may potentially impact benthic macrofaunal community composition as well as biomass. Macrofaunal benthic biomass increases moving northward from south of St. Lawrence Island through the Chirikov Basin and Bering Strait into the Southeast Chukchi Sea, reflecting an increase in annual primary production and export of carbon to the benthos (Grebmeier et al., 2015a).
In the Pacific Arctic, the persistence of seasonal sea ice has significantly declined since 2005 between St. Lawrence Island (SLI) and Bering Strait and northward into the Chukchi Sea, although not south of SLI until very recently (Frey et al., 2015, 2017; Grebmeier et al., 2015a). Changes in Pacific water advection via current flow into the Arctic can influence water column processes that likely contribute to observed shifts in marine species composition, such as from bivalves to polychaete-dominated systems south of SLI (Grebmeier and Cooper, 2016), northward movement of organisms (e.g., subarctic bivalve species and opilio crabs in the Chukchi Sea; Sirenko and Gagaev, 2007; Bluhm et al., 2011), variable carbon cycling (e.g., decline in sediment oxygen uptake indicative of carbon supply in some regions (Grebmeier, 2012), and changing plankton populations (Nelson et al., 2014).
Both in situ production and advection of upstream phytodetritus to these regions (Hill et al., 2018) contribute to persistent biological hotspots that connect benthic prey (e.g., clams, polychaetes, and amphipods; Grebmeier et al., 2015a; Kędra et al., 2015) through food webs to upper trophic benthivorous predators (e.g., gray whales, walruses, and spectacled eiders; Jay et al., 2012, 2014; Grebmeier et al., 2015a; Lovvorn et al., 2015; Moore, 2016). Earlier spring sea ice retreat and later fall sea ice formation are changing the phenology of primary production (Frey et al., 2017), which directly impacts benthic community production (Grebmeier et al., 2006a; Hunt et al., 2013). Major ecological shifts can be expected with reduced sea ice conditions and seawater warming, including changes in:
-
The timing of sea ice retreat (Frey et al., 2014, 2015, 2017; Grebmeier et al., 2015a)
-
Water column production (both increases and decreases; Nishino et al., 2016; Hill et al., 2018)
-
Zooplankton growth and biomass (higher growth rates for smaller, less lipid-rich species with rising temperatures, with a negative impact on larger, lipid-rich zooplankton species (Coyle et al., 2011; Eisner et al., 2013; Ershova et al., 2015)
-
The export of carbon production to the benthos (Grebmeier et al., 2006b, 2015a, 2015b)
-
Sea ice habitat, including its disappearance, which will affect upper trophic level species (e.g., reduced sea ice persistence is a negative impact for sea ice-obligate species; Jay et al., 2014; Lovvorn et al., 2015)
-
Range extensions for boreal species, which will shift northward (Doney et al., 2012; Renaud et al., 2015)
Previous evaluations of portions of this time series indicate declining macrofaunal biomass and changing composition at some sites (e.g., south of the SLI region, by Grebmeier et al., 2006b; Grebmeier, 2012; Grebmeier and Cooper, 2016; and in the Southeast Chukchi Sea region, by Grebmeier et al., 2015a, 2015b). By comparing sampling in the Chirikov Basin during the first decade of the 2000s with sampling undertaken in the mid-1980s, Coyle et al. (2007) identified the beginning of a decline of ampeliscid amphipods in the Chirikov Basin. That study concluded that the decrease in amphipod biomass was due either to declining food supply or to increasing gray whale predation.
A core reason for the initiation of the Distributed Biological Observatory (DBO) in 2010 was to provide an observing framework for understanding changing Arctic ecosystems and to expand on existing knowledge (Moore and Grebmeier, 2018). The DBO has developed into an internationally coordinated network of time series transects for evaluating ecosystem status and trends across a latitudinal gradient in the Pacific Arctic region. Long-living benthic organisms are integrators of overlying water column processes and thus are a valuable component of this observing network for monitoring shifting environmental conditions and top-down feeding pressures. The benthic hotspots identified over the last decades as persistent in the Pacific Arctic formed the basis of the DBO (Grebmeier et al., 2010, 2015a; Iken et al., 2010).
The objective of this study is to evaluate the current response of the benthic macrofaunal community in the Bering Strait region to declining sea ice persistence, warming seawater, and other varying environmental conditions. To investigate biological responses to these key drivers, we undertook a robust trend analysis of benthic macrofaunal populations and key environmental drivers at three hotspot sites in the Pacific Arctic. Here, we discuss the implications of shifting biological populations to upper trophic level consumers as well as overall ecosystem structure.
METHODS
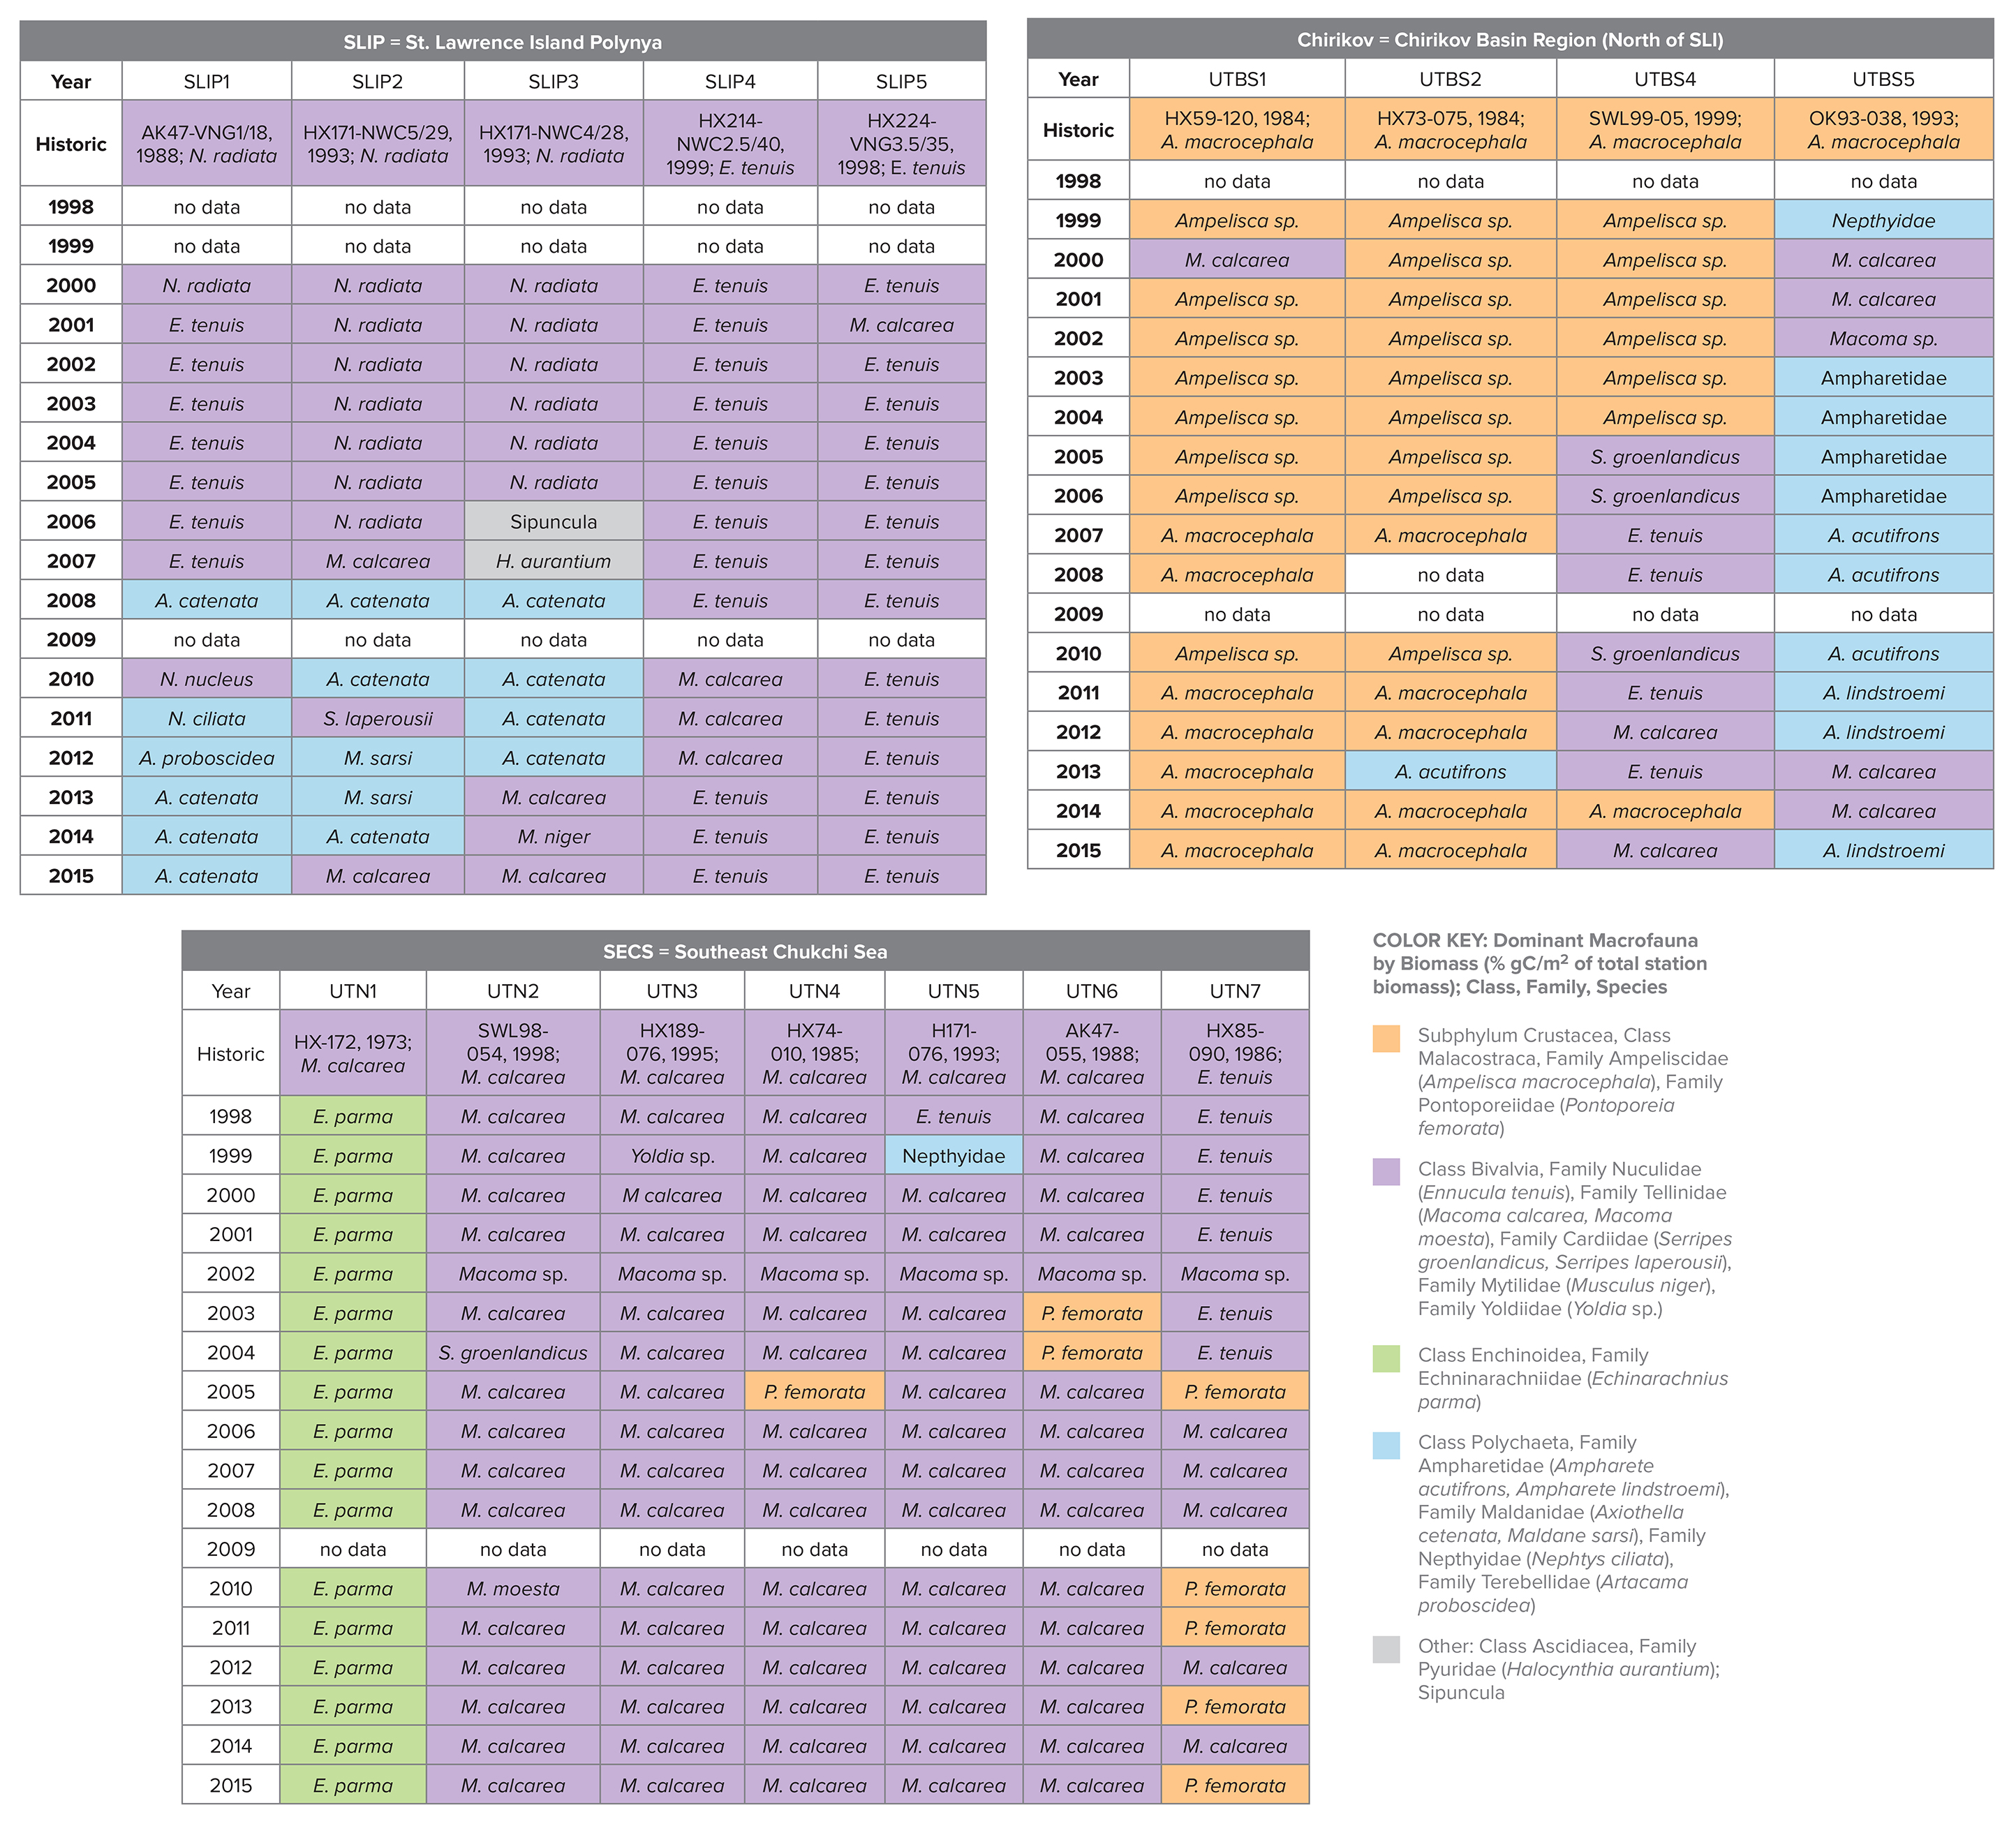
The study regions—St. Lawrence Island Polynya (SLIP), Chirikov Basin (Chirikov), and Southeast Chukchi Sea (SECS) (Figure 1)—have the longest time series records of benthic macrofaunal biomass and environmental parameters in the Pacific Arctic (Grebmeier et al., 2015a). These three persistent hotspots have all exhibited recent changes in biomass and species composition (e.g., for SLIP, Grebmeier and Cooper, 2016; for Chirikov, Grebmeier et al. 1995 and Coyle et al. 2007; and for SECS, Grebmeier et al. 2015b). We present the current DBO time series data using the station names initiated in 1998–2000 (before the DBO began) but that extend into the DBO effort, specifically SLIP (five time series stations identified as SLIP1 to SLIP5), Chirikov (four time series stations identified as UTBS1, 2, 4, 5), and SECS (seven time series stations identified as UTN1 to UTN7) (Figure 1). Retaining the standard names used since 1998 allows for comparison of regions and station names with data held in US national data archives.
As part of our analysis, we determined annual sea ice persistence and seasonal variability using Scanning Multichannel Microwave Radiometer (SMMR), Special Sensor Microwave/Imager (SSM/I), and Special Sensor Microwave Imager/Sounder (SSMIS) passive microwave satellite observations from the beginning of satellite records in 1979. The data from 1998 to 2018 were evaluated in the context of the time series data from hydrographic and benthic biological collections made during annual July cruises of Canadian Coast Guard Ship (CCGS) Sir Wilfrid Laurier. In the following section we summarize the methodologies used in the analyses of environmental conditions and benthic macrofaunal collections.
Satellite Observations: Sea Ice Cover (Annual Persistence and Timing of Breakup/Freeze-up)
Annual sea ice persistence, timing of sea ice breakup, and timing of sea ice freeze-up were determined from sea ice concentrations (spanning the years 1979–2018) derived from the SMMR, SSM/I, and SSMIS passive microwave instruments, calculated using the Goddard Bootstrap (SB2) algorithm (Comiso et al., 2017a, 2017b). These data are available at 25 km spatial resolution from SSM/I and SSMIS daily and SMMR every other day (but the latter were temporally interpolated to create a daily time series). As is standard in most studies, we used a 15% ice concentration threshold to define the presence vs. absence of sea ice cover. In particular, the timing of sea ice breakup (freeze-up) was determined by flagging the date on which a pixel registered two consecutive days below (above) a 15% sea ice concentration threshold; on this basis, we defined the breakup period as March 15 to September 15 and the freeze-up period as September 15 to March 15. Requiring two consecutive days of the breakup/freeze-up condition ensured that the defined events were persistent rather than spurious occurrences (see Frey et al., 2014 and 2015, for further details of methodology). In this paper we compare sea ice parameters over the length of our available benthic time series data (1998–2015), although we present the full sea ice satellite record for broad-scale evaluation of this key driver.
Field Water Column, Sediment, and Macrofaunal Data
Water Column
Water column temperature, salinity, and chlorophyll a (chl a) were collected at standard depths at all time series benthic stations where macrofaunal organisms were collected during our 1998–2015 study. In addition to data collected using a Sea-Bird CTD system, water column chl a was determined at sea following the standard methods outlined in Cooper et al. (2012). Further details on methods of collections and analyses are available in Grebmeier et al. (2015a). Metafiles and associated data sets are available through the NSF Arctic Data Center (https://arcticdata.io/).
Sediments
Surface sediment grain-size samples were collected at each time series station using a van Veen grab with a 0.1 m2 catch area. Surface sediment chl a was determined at sea following procedures outlined in Cooper et al. (2012). A subsample of the surface sediments was also frozen and subsequently analyzed at our land-based laboratory for total organic carbon (TOC) and nitrogen content (TON), δ13C values, and sediment grain size following standard procedures outlined in Grebmeier et al. (2006a, 2015a).
Benthic Macrofauna Biomass
Four replicate van Veen grabs were collected at each time series station for taxonomic identifications. Sediments were sieved through 1 mm mesh screens, with the biological samples subsequently preserved with 10% buffered seawater formalin for post-cruise taxonomic identification and wet weight biomass determinations. Benthic analyses were primarily undertaken at the University of Tennessee, and after 2008, at the Chesapeake Biological Laboratory, excluding samples from 2007 and 2008. Samples collected during Sir Wilfred Laurier voyages 07 and 08 were sorted at the Institute of Oceanology of the Polish Academy of Sciences in Sopot, Poland. Mobile epifauna were excluded from the analyses because of the assumption that they are not quantitatively sampled with grabs (Grebmeier et al., 1989). Each collected taxa with a formalin preserved wet weight was converted to carbon dry weight based on carbon conversion values determined by Stoker (1978) and Grebmeier et al. (1989). Macrofaunal organisms were typically identified to family level, with dominant fauna by biomass identified to species.
All time series benthic data were sampled consistently each year, with a few exceptions; one Chirikov station was not sampled in 2001, and 2009 sampling was limited and did not occur in July. Some earlier (pre-1998) benthic data collected in a manner consistent with our time series is presented to set the stage for a focused evaluation of the more continuous 1998–2015 data (Table 1). Specifically, we began our standard time series in 1998 (SECS), 1999 (Chirikov), and 2000 (SLIP) after we identified regions of high biomass from the pre-1998 record.
Table 1. Station information for the annual July benthic time series stations occupied in three sampling regions in the northern Bering Sea—St. Lawrence Island Polynya (SLIP), Chirikov Basin (Chirikov), and Southeast Chukchi Sea (SECS)—from 1998 to 2015, coincident with the original historic station names and month/year of collections. The historic station numbers/names and the cruise identifications that initiated the later time series are provided. HX = Alpha Helix. AK = Akademik Korolev. OK = Okean. SWL = Sir Wilfrid Laurier. Note that only the ship, station number, and date of collection (June 1973) were available for S.W. Stoker’s thesis research at station UTN1. > High res table
|
Statistics
Trend analyses were performed on sea ice persistence, bottom water temperatures, and benthic biomass (gC/m2) for the years 1998–2015 using a Theil-Sen median slope estimator (Sen, 1968). The Theil-Sen trend uses a robust non-parametric trend operator that is particularly well suited for assessing the rate of change in short and/or noisy time series (Hoaglin et al., 2000). The statistical significance of the Theil-Sen trends (p <0.05) was then established using the non-parametric Mann–Kendall test for monotonic trend (Mann, 1945; Kendall, 1975). We also used a double Grubbs’ test (Grubbs, 1950, 1969; Grubbs and Beck, 1972) to determine whether the two greatest (or lowest) values are outliers, where all outliers reported were significant at p <0.0001. Spearman’s rho rank correlation analysis was used to determine correlations among water column and sediment parameters in relation to benthic biomass. Software used included Microsoft Excel and JMP Pro 13.1.
RESULTS
Sea Ice Persistence via Satellite Observations
Annual sea ice persistence varied without obvious trends in the SLIP region for the length of the satellite record until 2012, when a decline began and then accelerated, including two significant outliers in the trend of annual sea ice persistence in 2017 and 2018 (p <0.0001; Figure 2a). The macrofaunal biomass trend period in the SLIP region is shown as gray shading (2000–2015) in relation to the full satellite record (1978–2018). We have observed earlier sea ice breakup over the last five years in the SLIP region, with apparent acceleration (i.e., outliers) of sea ice breakup in 2017 and 2018 (p <0.0001; Figure 2a). Freeze-up also has significant outliers (i.e., delays), with later dates in 2016 and 2017 (p <0.0001; Figure 2a). However, in spite of these significant outliers, the sea ice trends are not statistically significant because we used a median (Theil-Sen) trend that is insensitive to wild/inconsistent outliers, such as those that occurred in 2017 and 2018. Thus, until the declining sea ice persistence, spring breakup, and fall freeze-up trends become robust and continue in future years, we can only point out these outliers as being indicative of a significant change from prior patterns.
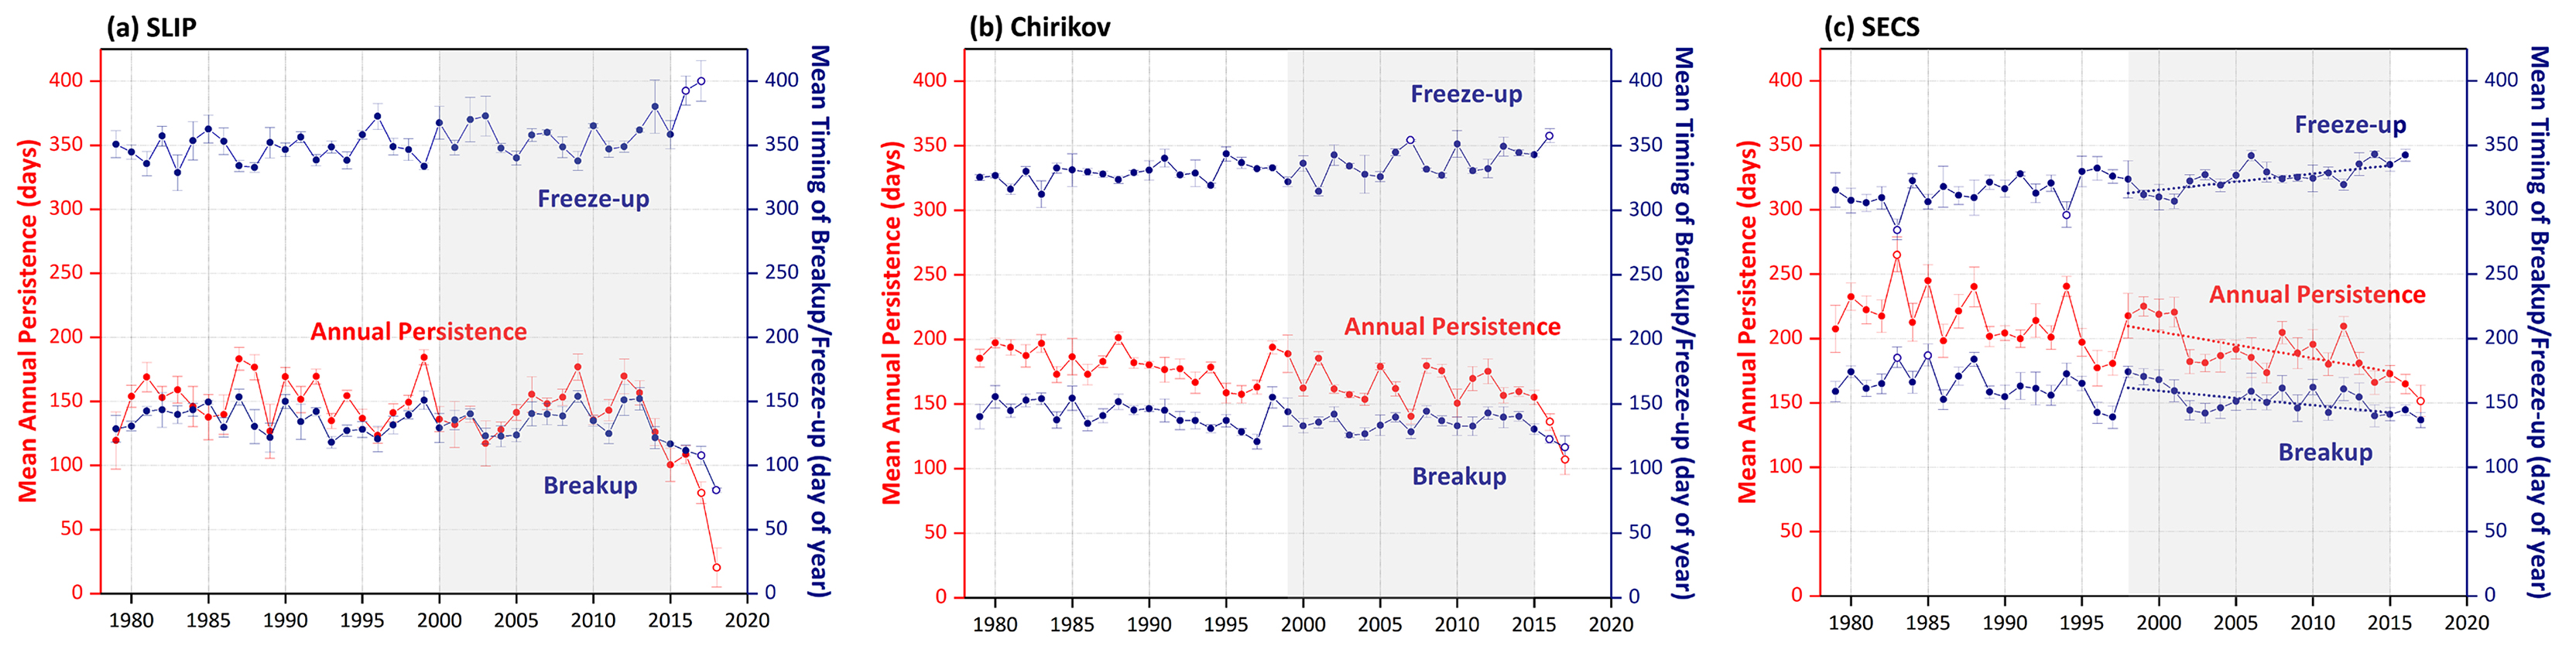
Figure 2. Sea ice variability (annual persistence and the timing of breakup/freeze-up) in the (a) SLIP, (b) Chirikov, and (c) SECS regions from 1979 to 2017 (to 2018 for SLIP). The error bars depict spatial variability within the polygons, the benthic time series lengths for each region are grayed out, and the Mann-Kendall test for trend was performed over the same time period as the benthic macrofaunal collections. The only statistically significant sea ice trends (p <0.05) over the defined grayed out periods are for the SECS time series (panel c), where the dotted lines represent Sen’s median slope estimators. The open circles are the significant outliers identified using a double Grubb’s Test (p <0.0001). > High res figure
|
A similar set of sea ice trends are evident for the Chirikov region over the longer satellite record from 1978 to 2012 that shows sea ice persistence declining by ~ −9 days/decade (Frey et al., 2015; Grebmeier et al., 2015a), and particularly since 1998 (Figure 2b). Sea ice persistence has been trending even lower over the last five years, with significant outliers (i.e., acceleration) of reduced ice in 2007 and 2017 (p <0.0001; Figure 2b). Sea ice breakup has occurred earlier in the year since 2014, with a significant outlier for 2017 (p <0.0001; Figure 2b). The freeze-up period in the Chirikov region has occurred later in the season, with significant outliers for later freeze-up in 2007 and again in 2016 (p <0.0001; Figure 2b).
For the SECS region, sea ice persistence has declined by ~ −12 days/decade (1978–2012; Frey et al., 2015; Grebmeier et al., 2015a). Notably, the only Sen median slope estimators that were significant over the subset of sea ice parameters for comparison with the benthic biomass trends outlined below occurred in SECS (Figure 2c, dotted lines), where trends were significant for declining annual sea ice persistence, later freeze-up, and earlier sea ice breakup (p <0.05). Over this shorter time series, annual sea ice persistence has been declining since 2001, with an accelerated decline starting in 2013. Note there was a statistically significant outlier deepening the declining trend in 2017 (p <0.0001, Figure 2c). The timing of freeze-up has become later in the fall, with the latest freeze-up occurring in 1997, varying without trend in the 2000s, and a later freeze-up trend beginning in 2013 until the end of the record in 2017 (Figure 2c). Spring breakup has been trending earlier since 2012.
Benthic Time Series (1988–2015): Macrofauna and Sediment Parameters
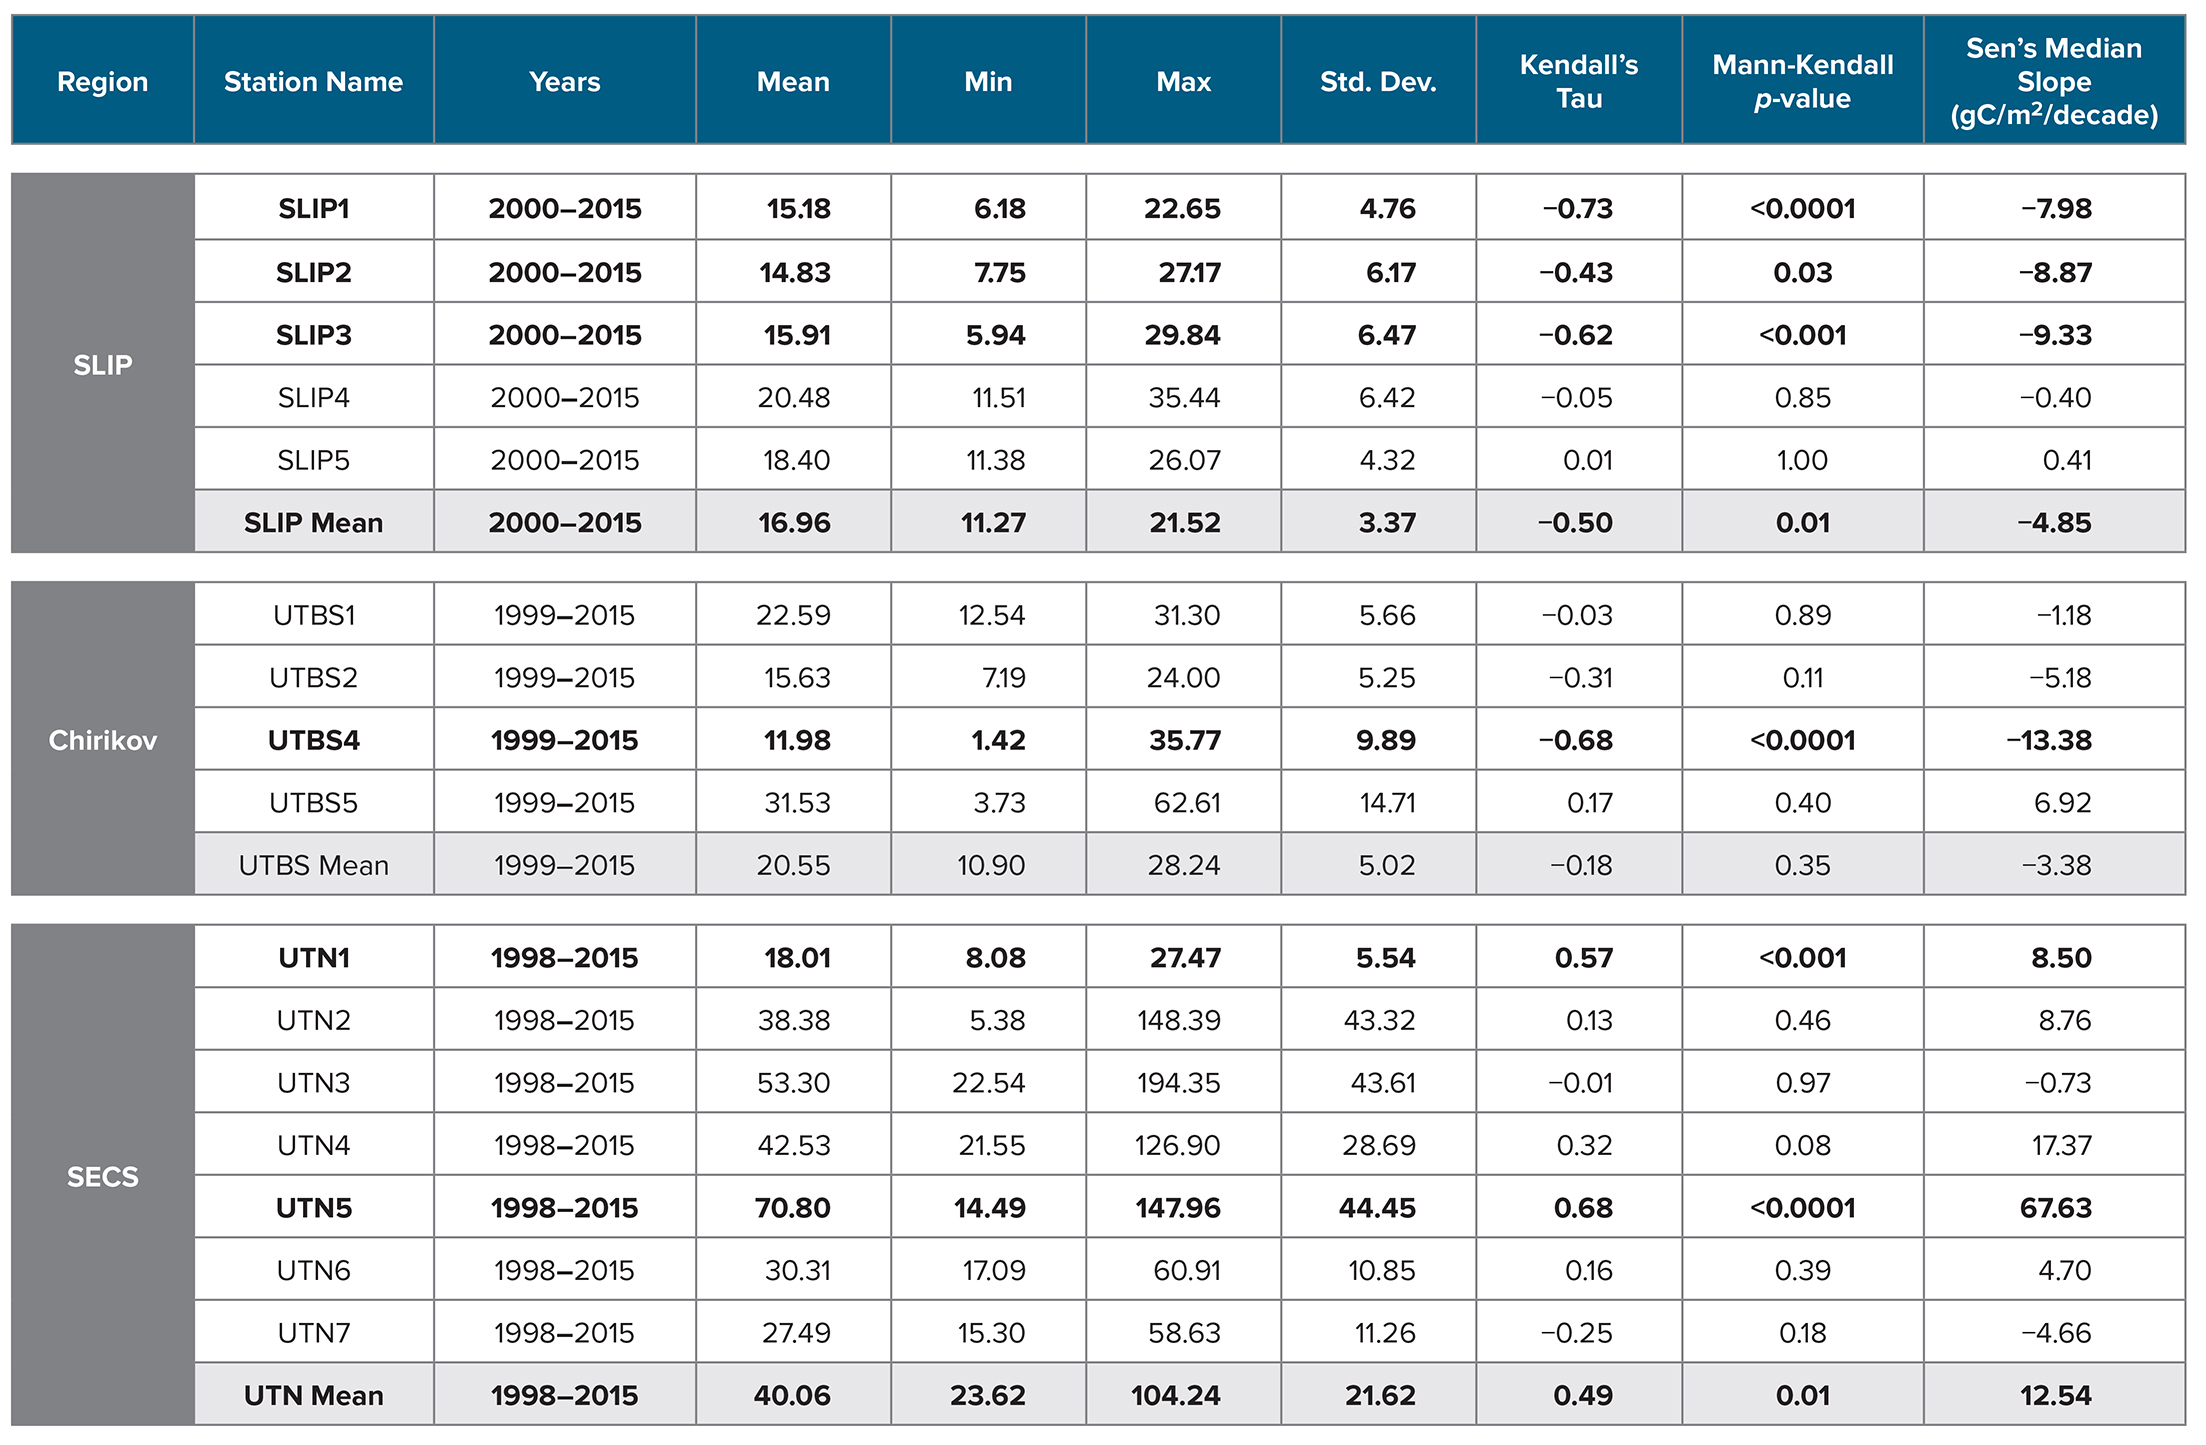
St. Lawrence Island Polynya (SLIP)
Time series macrofaunal data from the five stations (SLIP1–SLIP5) indicate that biomass in the southern portion of the SLIP hotspot region (SLIP1–SLIP3) has been declining since about 2005 relative to the stations further north (SLIP4 and SLIP5; Figure 3a). Notably, the core of this high benthic biomass hotspot was previously centered at 62°N, but it is now located further north around 63°N (Figure B2 in Box 1). The dominant faunal taxa for each of the three southern stations in the SLIP region have changed from mainly nuculanid and nuculid bivalves (Nuculana radiata and Ennucula tenuis, respectively) to mainly maldanid polychaetes (Axiothella catenata and Maldane sarsi) (Table 2; Figures 4a and 5). By comparison, the northern two sites (SLIP4 and SLIP5) have remained dominated by nuculid (Ennucula tenuis) bivalves, although in some years the tellinid bivalve Macoma calcarea has been dominant (Table 2).
Mann-Kendall trend analysis indicated a significant decline in benthic biomass in the southern three SLIP time series sites (SLIP1–SLIP3; Kendall’s tau range from −0.73 to −0.43, p ≤0.03 to <0.0001; Table 3, Figure 5). The Sen’s median slope statistic indicates a decline of −7.98 to −9.33 gC/m2/decade in biomass over the 2000–2015 period (Table 3). There were no statistically significant changes in the northern two SLIP time series sites (Table 3, Figure 5). An overall declining trend in the SLIP mean benthic biomass (all stations) was also significant (p <0.01).
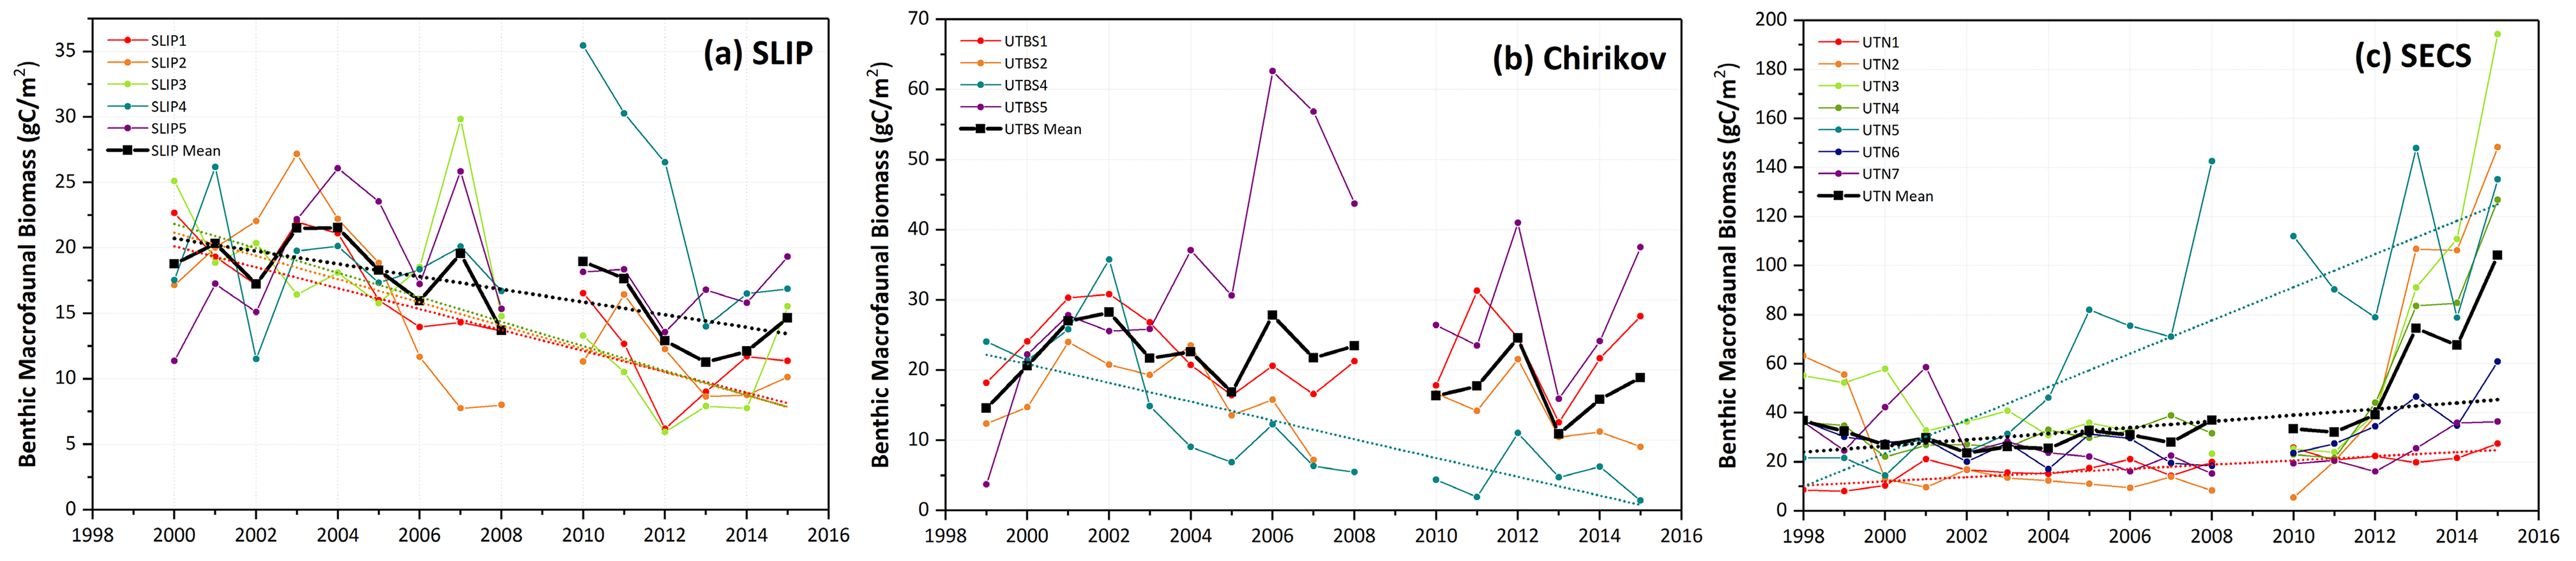
Figure 3. Time series data of individual station benthic biomass (gC/m2) as well as averages for the three regions over similar time periods: (a) SLIP, 2000–2015, (b) Chirikov, 1999–2015, and (c) SECS, 1998–2015. Sen’s median slope estimators are shown only for those time series that show statistically significant trends (Mann-Kendall test for trend, p <0.05), with statistics provided in Table 3. Note the increasing biomass scale from the SLIP region (south) to the SECS region (north). No July field program occurred in 2009. > High res figure
|
Table 2. Dominant macrofauna species by largest % of total station biomass (gC/m2). Colors indicate amphipods (orange), bivalves (lavender), polychaetes (blue), sand dollars (green), and others (gray) over the 1998–2015 period for the SLIP, Chirikov, and SECS stations. The historic name that initiated the time series effort is provided in the top row, along with the research cruise name: HX = Alpha Helix, AK = Akademik Korolev, OK = Okean, SWL = Sir Wilfrid Laurier). The table’s key is the full taxonomic information for the dominant species in the table. > High res table
|
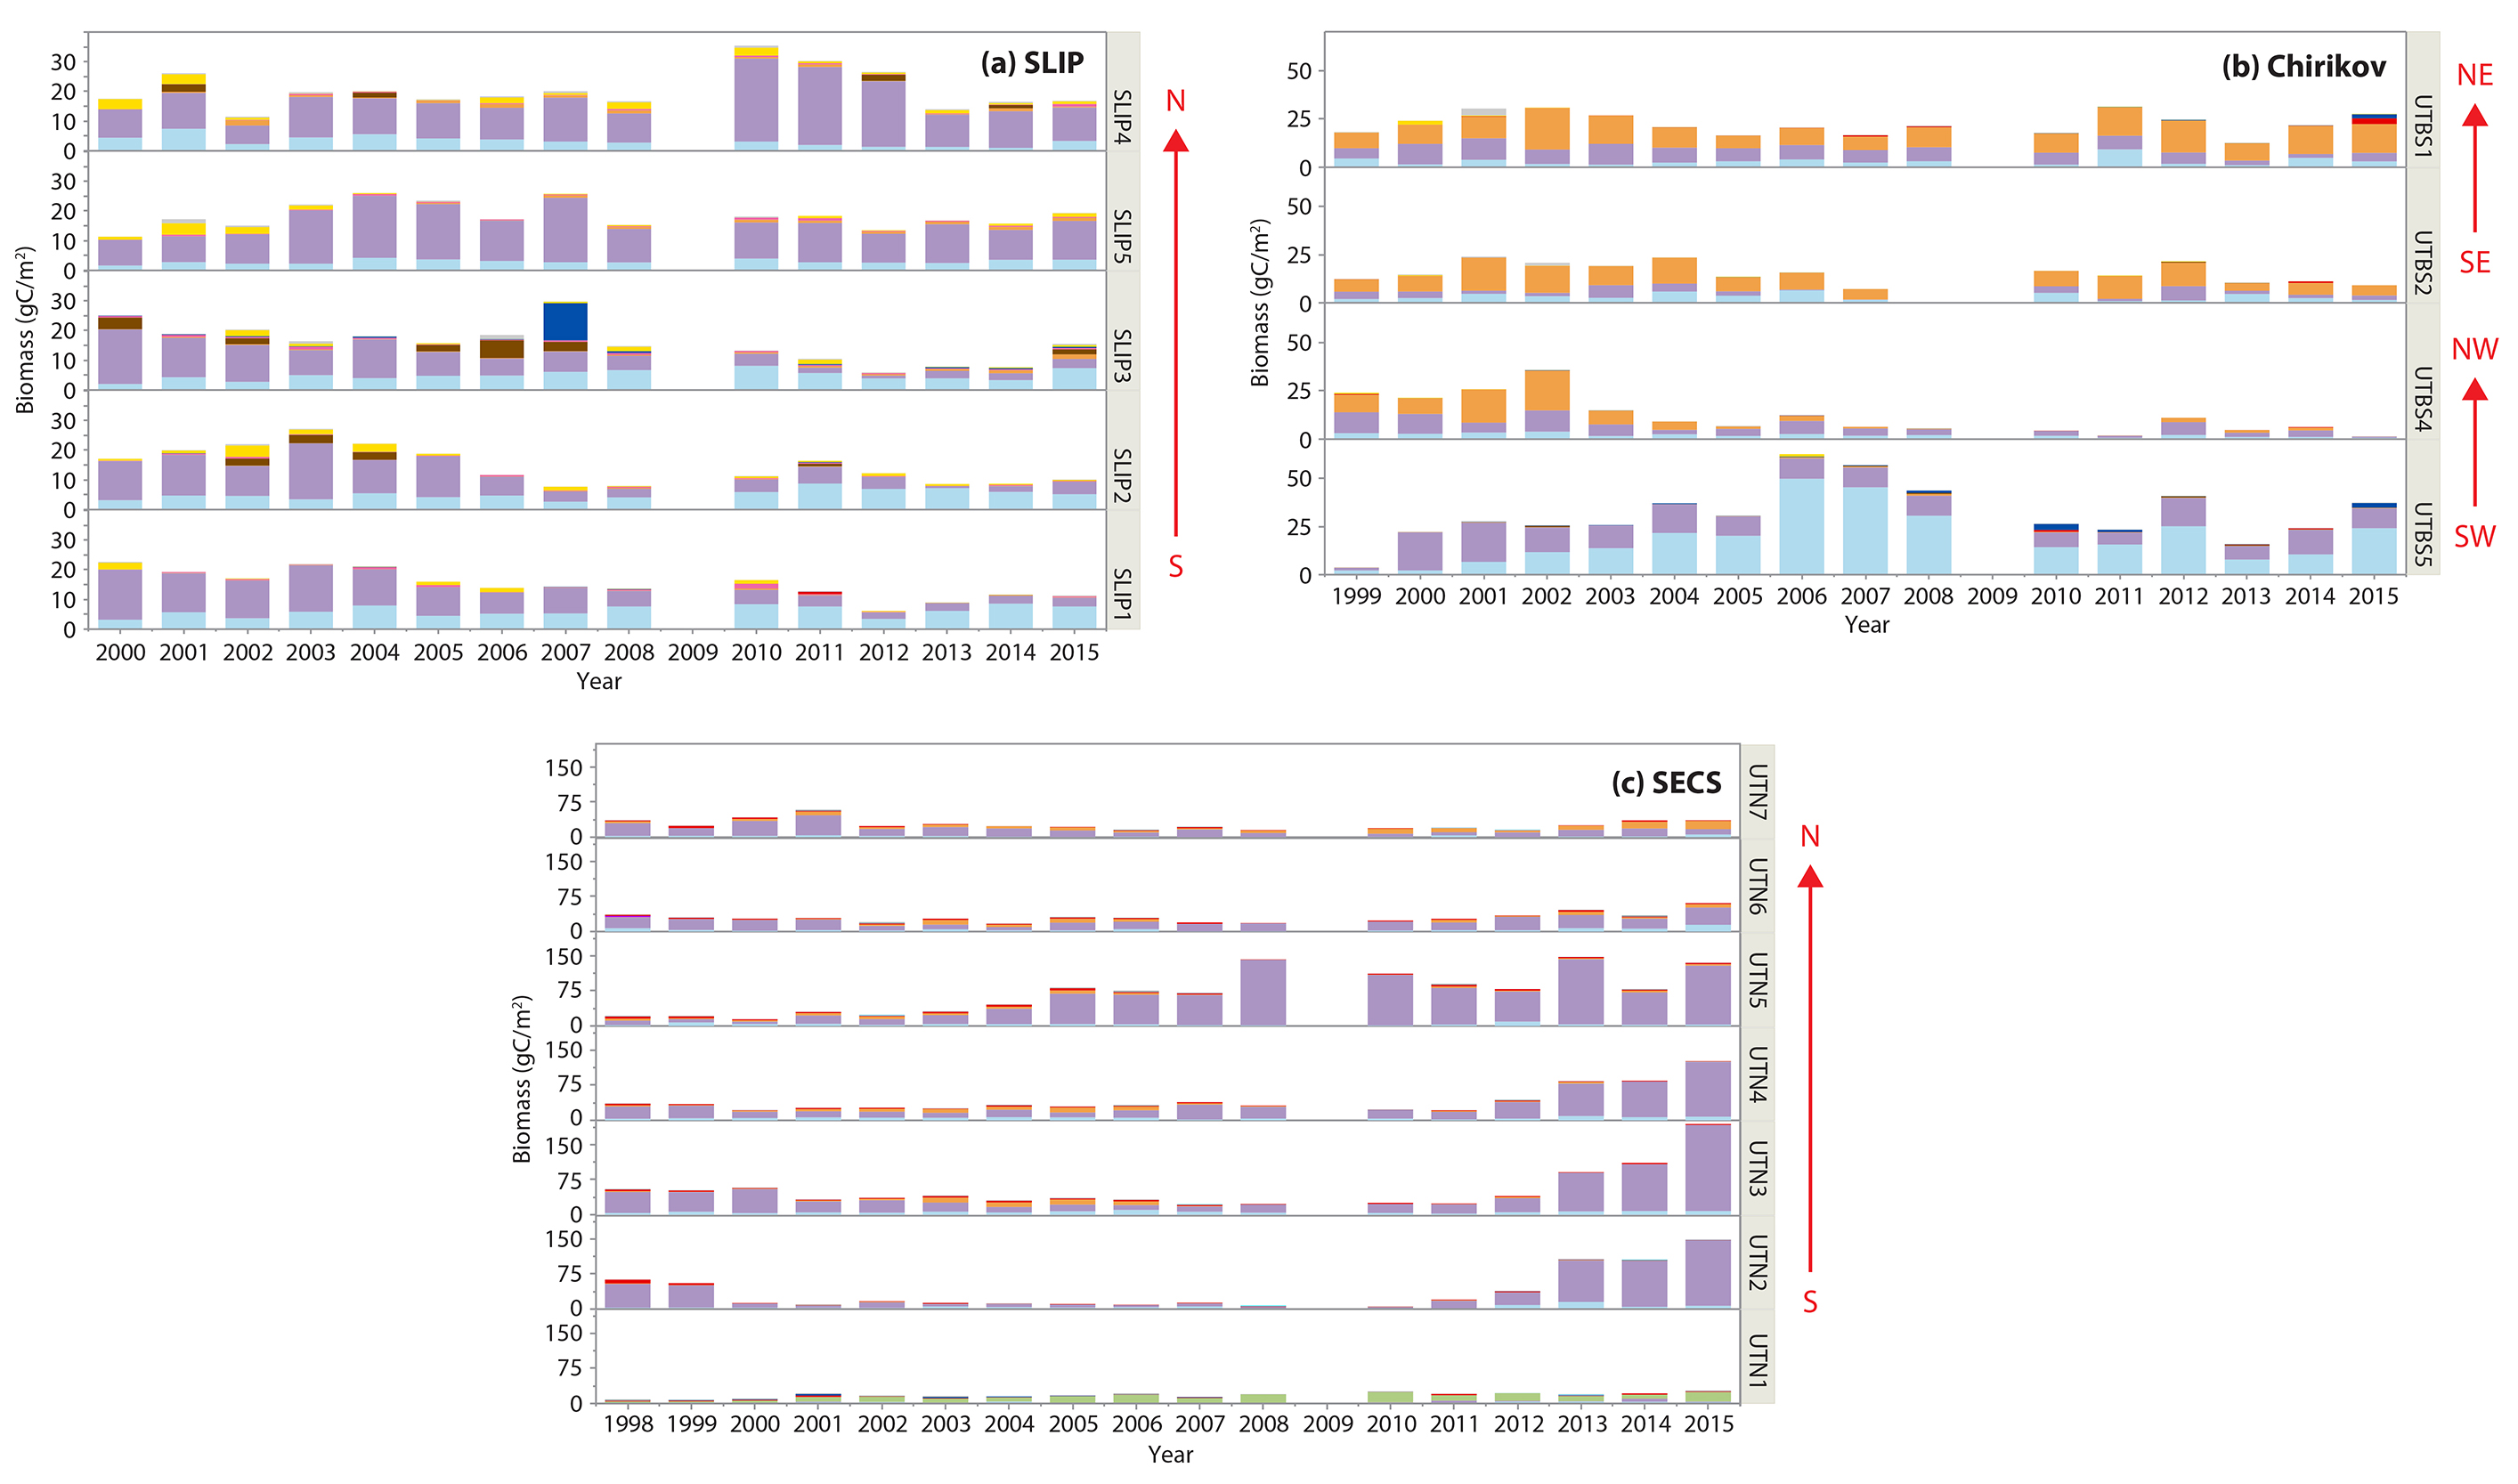
Figure 4. Time series histograms of macrofaunal biomass (gC/m2) for the different taxa at each station for the three regions: (a) SLIP, stations SLIP1–SLIP5. (b) Chirikov, stations UTBS1, UTBS2, UTBS 4, UTBS 5. (c) SECS, stations UTN1– UTN7. Colors designate the dominant faunal type: polychaetes (light blue), bivalves (lavender), and crustaceans (amphipods) (orange). Remaining taxa are color keyed. The red arrows indicate the general location of stations from South (S) to North (N) within each of the SLIP and SECS regions. The Chirikov region has four time series sites located Southwest (SW), Northwest (NW), Southeast (SE), and Northeast (NE) in the region. See Figure 1 for the spatial location of the time series regions and stations. > High res figure
|
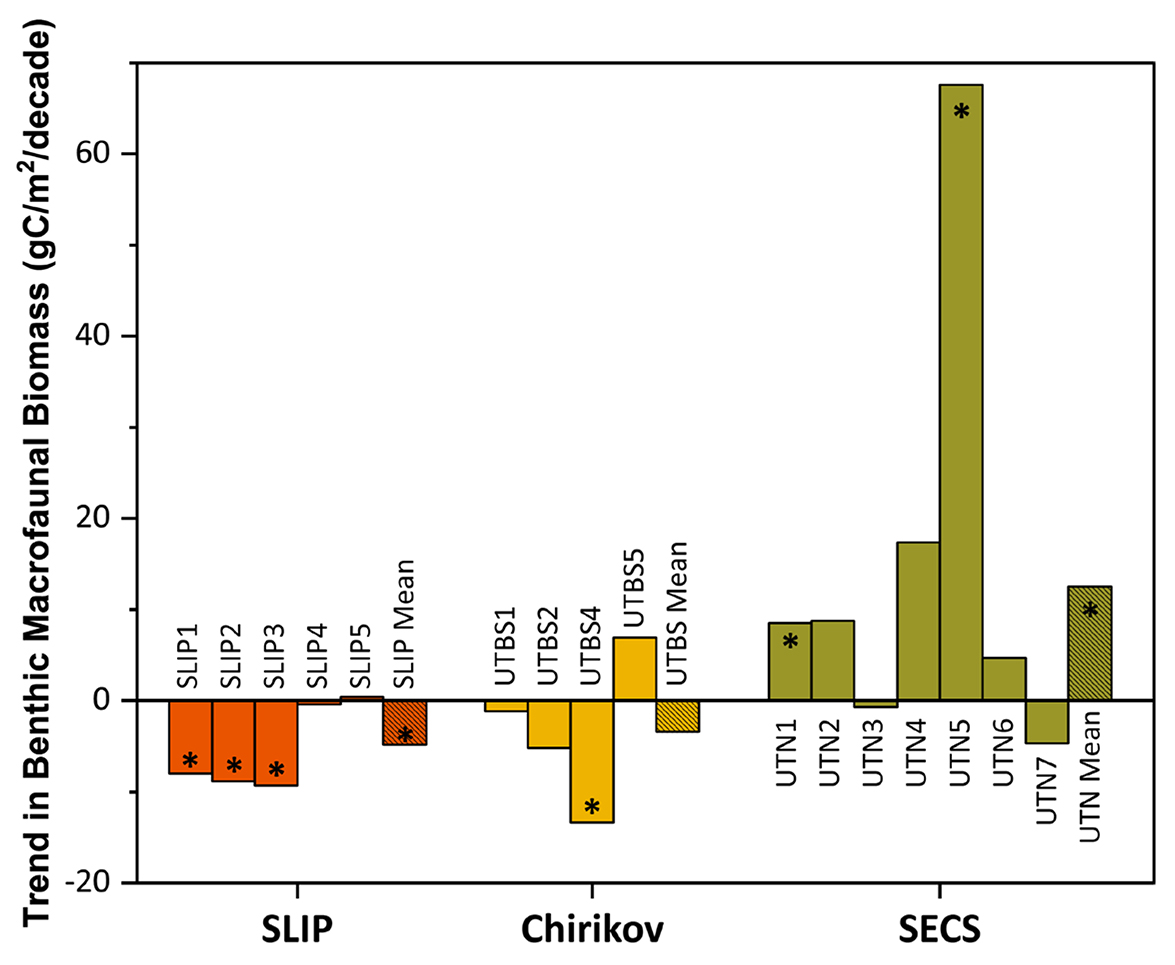
Figure 5. Trends (calculated as Sen’s median slope estimators) for benthic macrofaunal station biomass (gC/m2/decade) for the three time series regions: SLIP, Chirikov, and SECS. The asterisks (*) indicate those trends that are statistically significant (Mann-Kendall test for trend, p < 0.05) for each station within the three regions as well as their overall means (see Table 3 for summary statistics). > High res figure
|
Table 3. Time series of station benthic biomass (gC/m2) for all CCGS Sir Wilfrid Laurier stations from 1998 to 2015. Parameters include region, station name, year range of time series study, minimum (Min), maximum (Max), and standard deviation (Std. Dev.) of the station biomass value. The statistical value for the Kendall’s Tau and Mann-Kendall p-value, and Sen’s Median Slope (gC/m2/decade) are also provided. Bolded values are related to time series station trends with significant p value <0.05. SLIP = St. Lawrence Island Polynya region. Chirikov = Chirikov Basin region. SECS = Southeast Chukchi Sea region. > High res table
|
Chirikov Basin (Chirikov)
Four sites in the Chirikov Basin show high variability in biomass, but differences are expressed in more of an east-west direction due to water mass differences that affect productivity. Prior to the 1999–2015 time series, the dominant faunal taxa for each of these sites were ampeliscid amphipods (Ampelisca macrocephala; Grebmeier et al., 1989). By the time this benthic biological time series began in 1999, only three of the four stations were dominated by amphipods (Table 2, Figure 4b). Time series macrofaunal biomass data from the four time series sites indicate declining trends at UTBS1, UTBS2, and UTBS4 sites from about 2002 to 2010, with UTBS4 in the northwest continuing to decline while UTBS1 and UTBS2 to the east show increasing biomass values after 2010 (Figure 3b). Biomass at the UTBS5 station in the southwest portion of the Chirikov region increased from 1999 to 2006, followed by a general decline (Figures 3b and 4b). By the end of the time series in 2015, amphipods were only dominant at the two eastern stations (UTBS1 and UTBS2; Table 2, Figures 3b and 4b), and the northeast station (UTBS1) had the highest amphipod biomass of the two stations (Figure 3b). The two other time series sites shifted from a dominance of ampeliscid amphipods (A. macrocephala) to mainly nuculid bivalves (Ennucula tenuis) at UTBS4 and to ampharetid polychaetes (Ampharete acutifrons and A. lindstroemi) at UTBS5 (Table 2, Figure 4b).
The Mann-Kendall trend analysis indicates only a significant declining biomass trend at UTBS4 (−13.4 gC/m2/decade, with the Kendall’s tau value being −0.68, [p <0.0001; Table 3, Figure 5]). The Sen’s median slope statistic indicates a trend value of −13.38 gC/m2/decade over the 2000–2015 period (Table 3).
Southeast Chukchi Sea (SECS)
Benthic biomass data for the seven stations (UTN1–UTN7) in SECS indicate increases at many of the sites over the last five years (Figure 3c). All of the SECS time series sites were historically bivalve-dominated (Table 2, Figure 4c). However, UTN1 had switched to dominance by sand dollars (Echinarachnius parma) at the start of the continuous time series in 1998, and sand dollars remained the dominant fauna through 2015 (Table 2, Figure 4c). Stations UTN2-7 have been dominated by tellinid (Macoma calcarea) bivalves since 1998 (Table 2, Figure 4c). One new feature is the presence of more amphipods at the northern two stations (UTN6 and UTN7) in recent years (Table 2).
Only stations UTN1 and UTN5 and the overall mean for the seven stations have significant positive Kendall tau’s trends over the entire time series (Table 3, p <0.01; Figure 3c). UTN1 had a Kendall’s tau’s value of 0.57 (p <0.01) and a Sen’s median slope of 8.50 gC/m2/decade (Table 3, Figure 5). Further north, UTN5 has the most dramatic increasing biomass trend, with a Kendall’s tau value of 0.68 (p <0.0001) and a Sen’s median slope increase of 67.63 gC/m2/decade (Table 3, Figure 5). The overall UTN mean trend has a Kendall’s tau’s value of 0.49 (p <0.01) and a Sen’s median slope increase of 12.54 gC/m2/decade (Table 3, Figure 5). Stations UTN2–4 and UTN6 have increased steadily since 2010, and in 2015 stations UTN2 and UTN3 had higher biomass than UTN5 (Figure 3c), although the trend analysis indicates the largest statistically significant increase in biomass over time still occurred at UTN5.
Environmental Data Versus Benthic Biomass
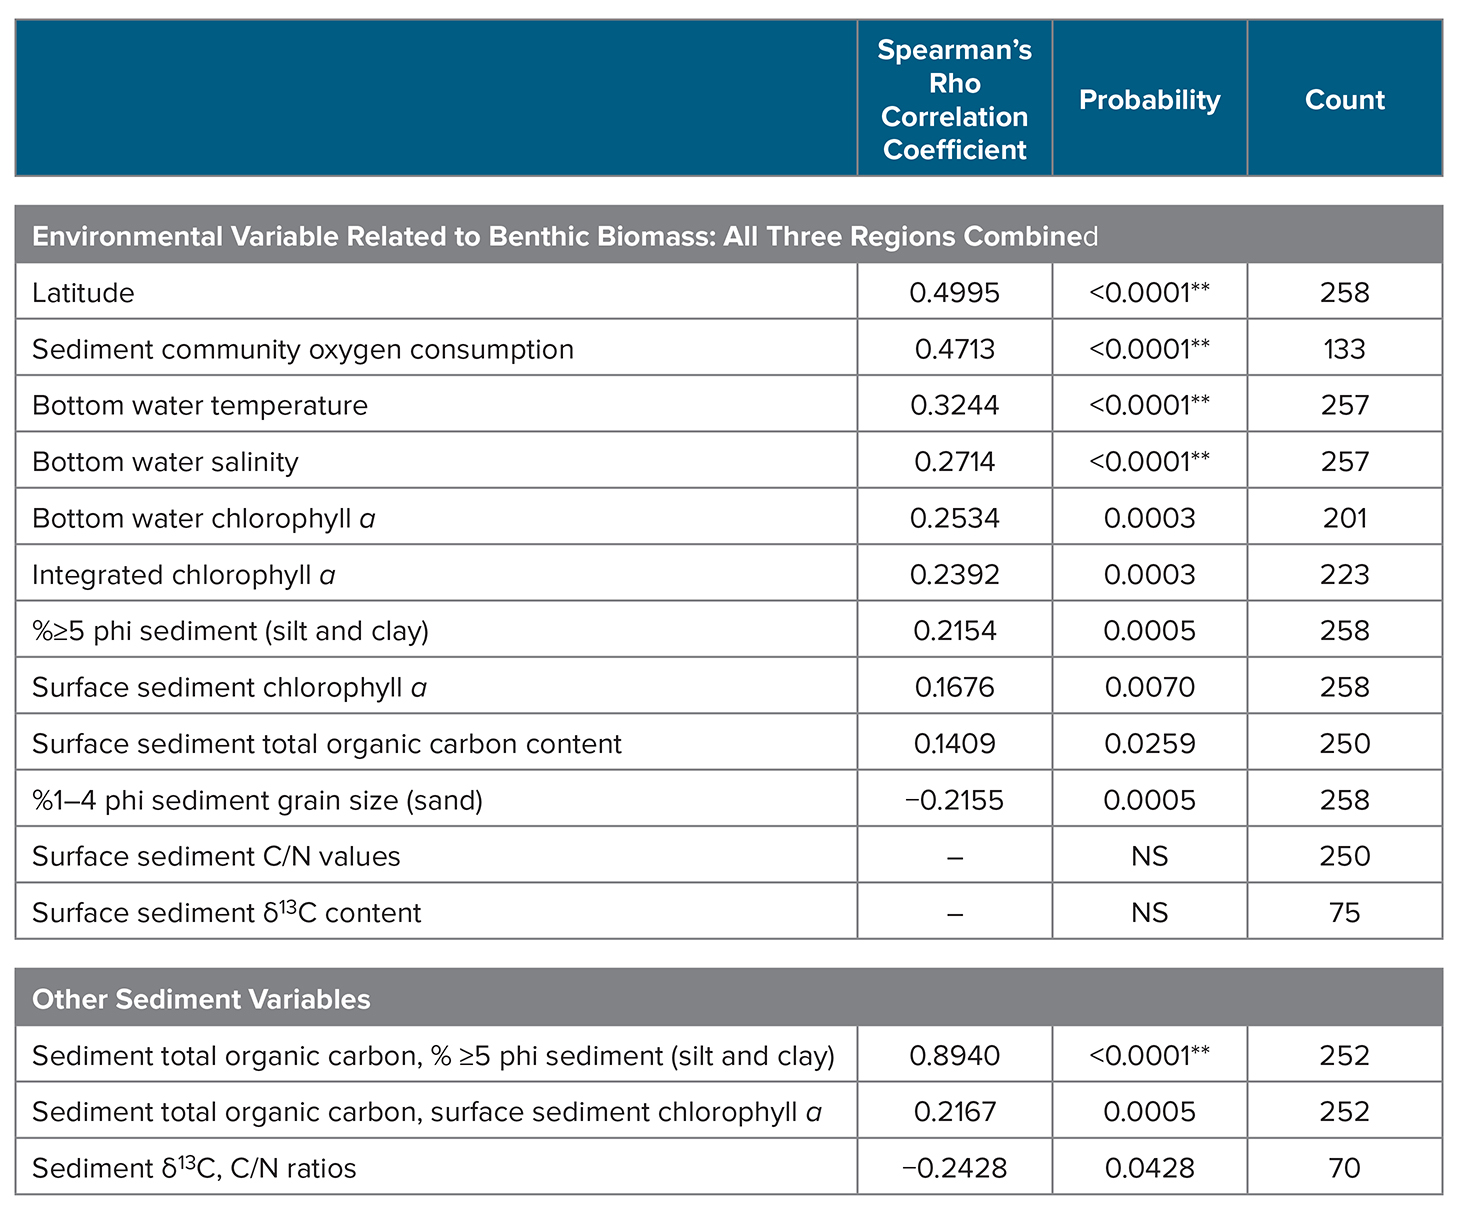
There were no significant bottom water temperature trends over time for any of the study regions (SLIP, Chirikov, or SECS; Mann-Kendall test for trend). However, a Spearman’s rank correlation analysis of benthic biomass (gC/m2) and environmental data collections for the time series indicates a positive relationship between benthic biomass and bottom water temperatures (Table 4, p <0.0001). We also found significant correlations between benthic biomass and increasing latitude, sediment community oxygen consumption (SCOC), bottom water salinity, integrated and bottom water chl a, sediment ≥5 phi (silt and clay) content, sediment chl a, and sediment % TOC (Table 4). Although benthic biomass in our current study was not directly related to some other possible indicators of carbon export to the sediments, such as sediment δ13C or C/N ratios, those two parameters were significantly related to each other (p <0.05; Table 4). We also found significant relationships between surface sediment TOC content and the silt/clay content (≥5 phi) of sediments and sediment chl a (p ≤0.05), which are similar to past findings (Table 4).
DISCUSSION
Sea Ice and Water Temperature Trends
Prior studies indicate no significant decline in sea ice persistence, spring breakup date, or fall freeze-up date for the SLIP region before 2012 (Frey et al., 2014, 2015; Grebmeier et al., 2015a). However, in our current analysis, we observed the beginning of a declining trend starting after 2012 that had significant accelerating outliers in 2017 and 2018 for both declining sea ice (Figure 2a) and rising bottom water temperatures (2018; Figure B1 in Box 1). The earlier sea ice breakup impacts the timing of the spring bloom, which has subsequent impacts on export production delivered to the underlying sediments. When combined with the observed later sea ice formation, these trends may have significant implications for the overall food supply to the benthos in the spring period. Over the 1998–2015 period, SECS also has exhibited significant trends towards declining annual sea ice persistence, earlier sea ice breakup, and later sea ice formation (Figure 2c).
Results of this study suggest that indicators of carbon export (e.g., SCOC, sediment chl a) are correlated with higher benthic biomass, corroborating previous studies (Grebmeier et al., 2006a; Lovvorn et al., 2018). Bottom water temperature was correlated to higher benthic biomass overall, although the Mann-Kendall trend analysis didn’t indicate significantly increasing temperature over time in our study for any of the three regions. However, as shown in the Box 1 highlight for the SLIP region, the bottom water temperature for July 2018 was higher by nearly 3°C (from −1.5°C in 2017 to +1.5°C in 2018). Notably, the July 2018 bottom water temperature has a standard deviation that does not overlap any previous values during the 18 years of our study, emphasizing the dramatic warming during this year. Inclusion of the 2016–2018 benthic data currently being analyzed and future time series collections will be critical for evaluating the impacts of declining sea ice conditions, increasing seawater temperatures, and their impact on spring primary production and export of organic material to the benthos in the SLIP region.
Benthic Biomass Trends
SLIP
The SLIP region is critical habitat for the world population of the diving spectacled eider (Somateria fischeri) that feeds upon the small bivalves in the area and is listed as threatened under the US Endangered Species Act (Grebmeier, 2012; Lovvorn et al., 2015). Our statistical trend analysis indicates a significant reduction in benthic biomass of key nuculanid bivalves that are important prey items for these sea ducks at the three southern time series sites in the SLIP region (Figures 3a and 5), along with a spatial expansion of higher biomass northward (Figure B2 in Box 1). Grebmeier and Cooper (2016) found a significant positive relationship between benthic biomass and silt and clay content of the sediments that is indicative of slower currents (Pisareva et al., 2015), corroborated in our current study (Table 4). The change in dominance from nuculanid bivalves to maldanid polychaetes started in 2009 and continues through 2015 (Table 2; Grebmeier and Cooper, 2016). The bottom water temperatures in the SLIP region were consistently coldest until 2018, when an unprecedented higher bottom water temperature was observed in July (Figure B1 in Box 1). This is likely due to the lack of full development of the polynya during the previous winter. These higher water temperatures may also be affecting the dominant nuculanid and tellinid clams (Table 2, Figure 4a), which are the main prey for the winter foraging of spectacled eiders (see Box 1; Lovvorn et al., 2015). Bottom water temperature was previously not considered to be the dominant driver for this change in the SLIP region. Instead, it was suggested that changing hydrography influenced a decline in spring primary production (Lee et al., 2012) and limited the export of the spring phytoplankton bloom to the benthos. The combined observations of reduced winter sea ice (Figure 2a) that are used as habitat by the sea ducks and the declining spatial extent of the preferred bivalve prey (Figure 3a) are projected to have a negative impact on the diving sea duck (Lovvorn et al., 2015; Box 1).
Table 4. Spearman’s rho rank correlation statistics for macrofaunal benthic biomass (gC/m2) with water column and sediment parameters collected during July 1998–2015 via CCGS Sir Wilfrid Laurier for the combined three study regions: SLIP, Chirikov, and SECS (see Figure 1 for locations). Significant correlation at p ≤0.05, with values of p <0.0001 identified by **. NS = no significance. > High res table
|
Chirikov
The Chirikov Basin in the northern Bering Sea is an important summer feeding and transit area for gray whales as they move northward into the Chukchi Sea (Moore, 2016). The region is a known benthic prey hotspot for amphipods (Coyle et al., 2007), although recent observations indicate they are declining spatially, and their highest biomass regions are located to the northeast within the hotspot region (Figures 3b and 4b). Our time series data indicate shifts in population dominance from amphipods (prey for gray whales) to ampharetid polychaetes and bivalves (prey for fish and walruses) in the southwest (UTBS5) and northwest (UTBS4) portions of this region (Table 2, Figures 3b and 4b). These results indicate a spatial shift in the amphipod prey patch north and eastward. Probably a related change is that recently, gray whales appear to be expanding their range further north into the northern Chukchi Sea, near the Alaskan coast and the shelf east of Barrow Canyon, as well as increasing the length of their stay in the Arctic (Moore, 2016).
Only one of the Chirikov time series sites showed a significant declining trend for biomass (UTBS4; Table 3, Figure 3b) simultaneous with a macrofaunal change in dominance from ampeliscid amphipods in 1999–2004 to bivalves later in the time series (see Table 2, Figure 4b). However, station UTBS5, which was dominated by ampeliscid amphipods in the 1980s–1990s, switched to polychaete dominance and sometimes bivalves (Table 2, Figure 4b). These changes, like those in the SLIP region, are likely driven by changes in current flow affecting sediment grain size that is a key driver for faunal composition. For the two remaining time series sites dominated by ampeliscid amphipods (UTBS1, UTBS2), the higher biomass at the northeastern site (UTBS1) compared to the UTBS2 site south of it indicates a contraction of the maximum biomass for ampeliscid amphipods for this prey patch (Table 2, Figure 4b). To better resolve these changes, we recently added three stations to the DBO time series effort in order to track this apparent northern shift of the dominant gray whale biomass prey base of Ampelisca macrocephala.
SECS
Our SECS time series studies show an expansion both north and south over the last ~10 years of high benthic biomass (Figure 3c). This is likely due to an earlier retreat of sea ice (Figure 2c) and more open water production (Hill et al., 2018) that enhances the seasonal deposition of phytodetritus to the benthos (Nishino et al., 2016). The SECS region is largely bivalve dominated, primarily by M. calcarea (Table 2; Feder et al., 2007; Grebmeier et al., 2015a, 2015b). The most significant increasing trend in biomass in our study occurred at station UTN5, supporting a northward shift of benthic biomass from the northern Bering Sea to the Chukchi Sea (Figures 3c and 5).
A study by Goethel et al. (2018) corroborates these findings of increasing bivalve populations in SECS. This study found that the highest abundances of M. calcarea occurred in the more productive regions and were associated with higher surface sediment chl a inventories, a proxy for recent export of fresh phytoplankton to the benthos (Cooper et al., 2012). In addition, a synthesis of primary production studies indicated that the Southeast Chukchi Sea is characterized by seasonally high water column chl a production from late spring through summer (Hill et al., 2018). High seasonal levels of primary production are sustained by advection of nutrients through the Bering Strait, which drives production by large diatom cells with high lipid content in response to earlier sea ice retreat (Giesbrecht et al., 2018). However, Neeley et al. (2018) suggest that as the ice-free duration becomes longer in the Southeast Chukchi Sea, a consequence may be a lowering of phytoplankton biomass through shifts in phytoplankton community composition. This would potentially impact food web dynamics and carbon export that could be negative drivers for benthic biomass. Regardless, if SECS persists and increases as a major bivalve biomass hotspot, it could provide a more important food patch for walrus, although the lack of sea ice as habitat may make it more difficult for these large animals to access such offshore, high biomass sites (Jay et al., 2012, 2014).
Environmental Drivers for Benthic Change
Surface and bottom water temperature and salinity are driven by advective changes in the pressure head that influences northward flow through the Bering Strait, by wind events, and by movement of fronts over the shallow Pacific Arctic shelves (Coachman et al., 1975; Danielson et al., 2017; Woodgate, 2018). The benthic ecosystem is likely responding to drivers strongly related to surface water conditions (e.g., surface chl a blooms and early season and open water export of organic carbon to the underlying sediments; see Grebmeier et al., 2015a, and references therein). The benthic animals that dominate in the hotspot areas of the Pacific Arctic are adapted to bottom water temperatures that normally range from −1.8°C to ~4°C across the area, and food supply remains the major driver for benthic biomass in the Pacific Arctic (Grebmeier et al., 1989, 2006a, 2015a, 2015b). However, the coldest water temperatures (<−1.6°C) in the SLIP region have been present year-round, but have now been observed to retreat as of summer 2018. As a result, the 2018 positive bottom water temperatures (>0°C) (Figure B1 in Box 1) could potentially lead to a tipping point for northward migrations of additional Pacific species, including fish that could alter benthic food webs.
Satellite-derived sea ice and ocean color trend analyses reported by Frey et al. (2017) evaluated time series patterns of sea ice persistence and water column production using chl a as a proxy. Water column production was associated with the timing of sea ice breakup, specifically showing a positive chl a anomalies trend when breakup was relatively early and a negative chl a anomalies trend when breakup was delayed. The most notable positive anomaly in 2017 occurred during May, with high concentrations of chl a, averaging ~12 mg m–3 higher than the 2003–2016 mean. This bloom occurred across a relatively large area (~500 × 350 km) in the northwestern Bering Sea that includes the SLIP region (Frey et al., 2017). In addition, strong positive anomalies in chl a occurred during May in the SECS region where chl a concentrations averaged ~16 mg m–3 higher in 2017 than the 2003–2016 mean across a ~100 × 150 km area (Frey et al., 2017). High integrated chl a concentrations (>100 mg m–2) have been observed during ship-based studies in the Chirikov Basin and SECS (Grebmeier et al., 2015a, 2015b; Danielson et al., 2017), supporting these satellite observations. These findings suggest that more open water will result in enhanced primary production that may or may not increase export production to the underlying benthic communities, depending on the level of zooplankton grazers in the water column.
In a general sense, the key drivers for Arctic benthic systems can vary spatially owing to differences in sea ice persistence and timing of breakup, water column nutrient levels, seawater temperature, primary productivity, and pelagic grazing, all of which influence seasonal primary production and the associated export of carbon to the underlying sediments. Ongoing regional modeling efforts are evaluating these key drivers influencing biological ecosystem response (e.g., Feng et al., 2018; Goethel et al., 2018). A recent bivalve recruitment and population dynamics modeling study by Goethel et al. (2018) indicates that surface sediment chl a inventories, total organic carbon, and the percent of sediments ≥5 phi grain size as well as bottom water temperature are correlated with both the abundance and biomass of the dominant bivalve, M. calcarea, at both the SLIP and the SECS time series sites.
BOX 1. The St. Lawrence Island Polynya Region in the Northern Bering Sea: Has the Tipping Point for Change Been Reached in 2018?
Environmental and biological studies at the St. Lawrence Island Polynya (SLIP) time series sites in the northern Bering Sea indicate faster sea ice retreat over the last five years compared to the previous 25 years, with significant declining sea ice data outliers recorded in 2017 and 2018 (see main text). Coincidently, average bottom water temperatures at the combined five SLIP time series sites moved above 0°C for the first time in July 2018 compared to our previous July 2000–2017 field sampling records. Each SLIP site as well as the average for all five SLIP sites in 2018 showed bottom water temperatures that were statistically significant outliers (Figure B1). We interpret this dramatic decline in sea ice and coincident rise above 0°C of normally very cold bottom waters to be due to the previous winter’s lack of sea ice that would usually produce cold, saline water during the winter occurrence of this polynya (Grebmeier and Cooper, 1995, and references therein). The dramatic changes in sea ice persistence and bottom water temperatures are only now catching up with the biological changes that we have been observing since 2005 in the macrobenthic biomass dominated by bivalves, which provide food for diving sea ducks and walruses (Figure B2; Grebmeier, 2012). Coincidently, increasing biomass was observed at the northern time series sites (Figure B2). These findings highlight the importance of annual biological sampling together with physical parameter measurements to track environmental variability and change in order to develop models to help forecast future ecosystem change (Feng et al., 2018; Lovvorn et al., 2018).
Past studies suggest potential movement northward of fishes and other subarctic species in response to a reduction of the low temperature cold pool that forms when the SLIP is functioning (Grebmeier et al., 2006b). Mueter and Litzow (2008) projected continued warming of Pacific Arctic surface waters would promote northward expansion of pelagic fish species. Sigler et al. (2011) projected movement of demersal fish northward to the Chukchi Sea if the SLIP was reduced in overall function so that cold, saline waters were not produced over the winter due to lack of sea ice formation. In summer 2018, the uncertainty of the standard location of commercial pollock and cod in parts of the Bering Sea caused NOAA to support a quickly planned research trawling study into the northern Bering Sea. Preliminary results of this trawling effort found high levels of these fish in the Bering Strait region and suggested that the lack of significant sea ice formation in the northern Bering Sea, a record early season sea ice breakup, and very warm seawater have allowed fish to move further northward (Medearis, 2018). Whether the SLIP region has passed a tipping point that will move the region into a more pelagic system compared to the traditional benthic-dominated system can be characterized for the time being as uncertain, if not speculative, but ongoing time series studies in the region, including field, mooring, and satellite observations, are essential for tracking the biological and physical changes in the northern Bering Sea.
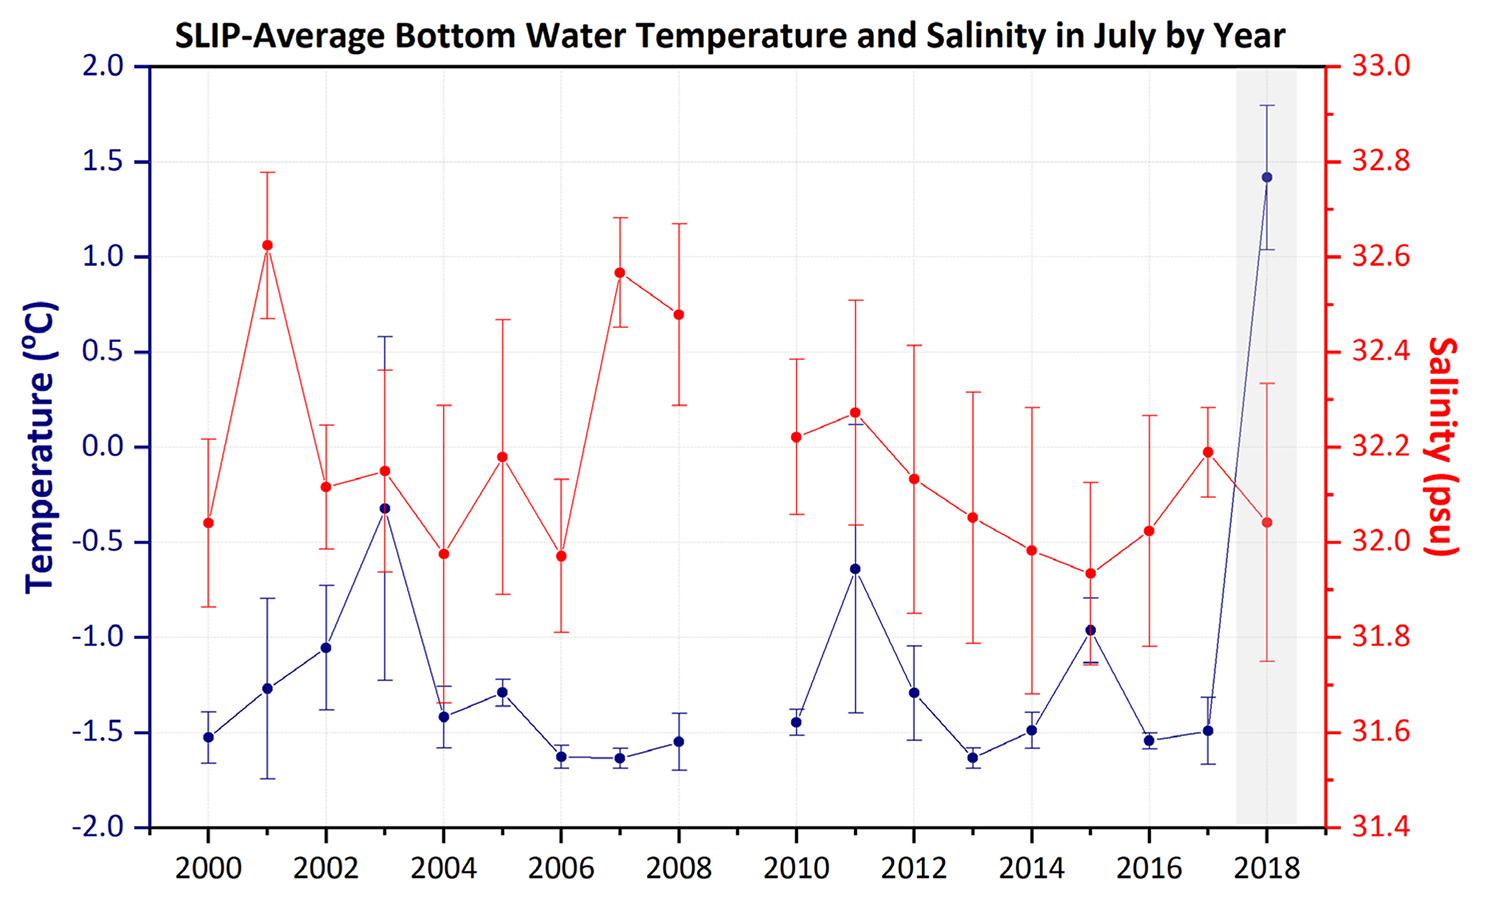
Figure B1. Time series of average bottom water temperatures (°C) and salinity (psu) measured in the St. Lawrence Island Polynya (SLIP) region during each July from 2000 to 2018 from CCGS Sir Wilfrid Laurier. The gray shading highlights the record’s highest bottom water temperature, which occurred in 2018. Standard deviation presented around the mean of five stations per year. Note the 2018 average and standard deviation value is outside any other measurements over the record. > High res figure
|
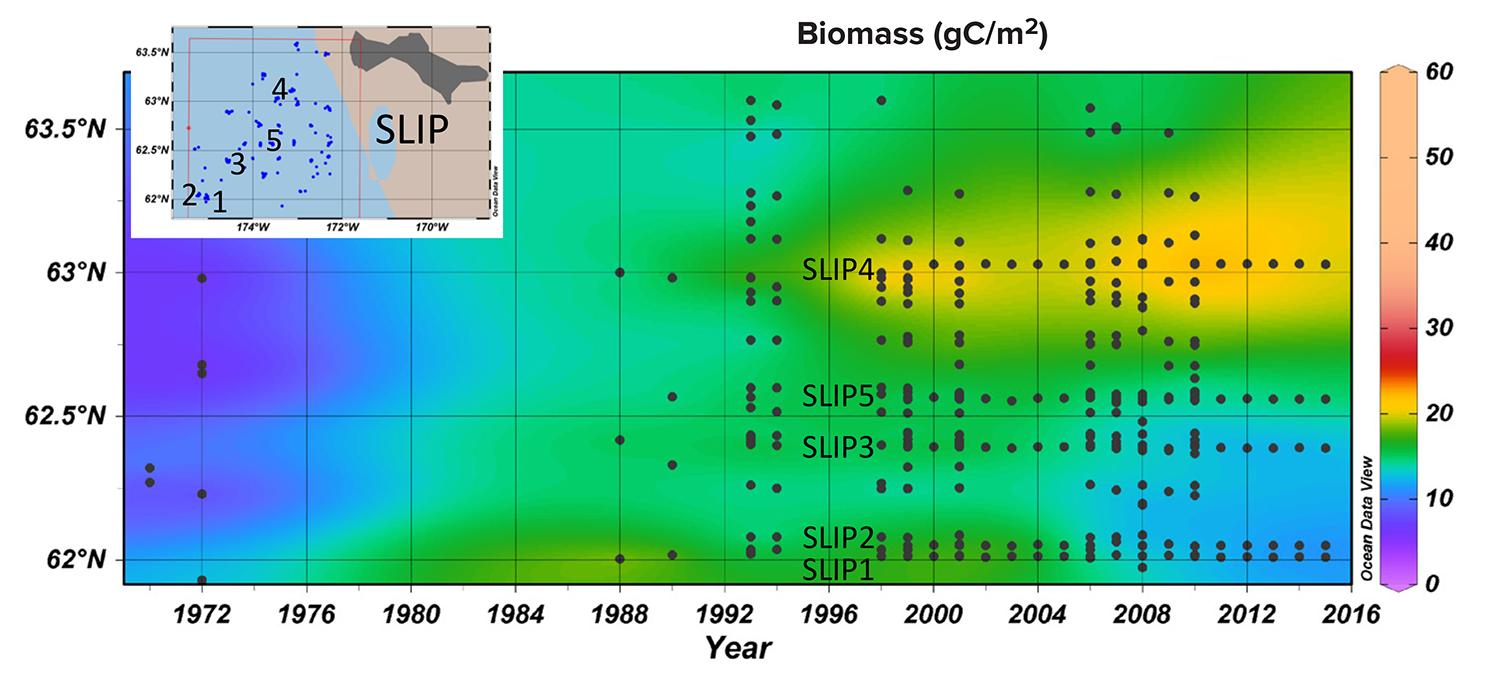
Figure B2. Time series of station benthic biomass (gC/m2) in the SLIP region south of St. Lawrence Island in relation to the longer data series in the SLIP bounding box from 1971 to 2015 (see Grebmeier et al., 2015a). The five core time series sites (SLIP1–SLIP5) are indicated in black on both the station map insert and the time series figure produced using the Ocean Data View (Schlitzer, 2016) software package. > High res figure
|
SUMMARY
The persistence of biological hotspots in the northern Bering and southern Chukchi Seas depends on reliable food supplies of spring ice algae and late spring/summer open water phytoplankton for the two areas to maintain their high benthic biomasses, which are in turn critical for migrating upper trophic level benthic consumers. The ongoing decline in seasonal sea ice cover and change in the timing of spring sea ice melt and associated ice edge production influence the timing of export production to the underlying benthos. Changing current speeds also influence where settling particulate organic carbon lands on the sediment and impacts benthic community composition. The biomass declines observed in the southern time series sites of the SLIP region, and changes from bivalves to polychaetes, are of concern because they can have consequences for the threatened status of the spectacled eider population. In the Chirikov Basin there has also been a contraction east and northward of the high biomass ampeliscid amphipod community, potentially affecting gray whale populations. Finally, though the Southeast Chukchi Sea hotspot north of Bering Strait has persisted since the 1980s, current investigations there indicate expansions south and north over the last decade of high macrofaunal biomass dominated by bivalves that can be utilized by walruses.
This study incorporates a portion of the suite of observing activities undertaken as part of the Distributed Biological Observatory. Such programs are of particular importance as biological sampling across a range of spatiotemporal scales is required to detect ecological shifts in response to environmental forcing. Repeat collection of various environmental and biological parameters in time and space, complemented by process studies, is facilitating the evaluation of seasonality and interannual Arctic ecosystem status and trends. In 2015, the DBO expanded into the Beaufort Sea, and in 2016 efforts were initiated to develop an Atlantic DBO in the Eurasian Arctic. New efforts are also being discussed for Baffin Bay and the Laptev Seas. One of the next steps in the DBO effort for the Pacific Arctic is to include a benthic conceptual model that can be used to test the importance of environmental drivers to biological responses. Some potential approaches include the Arctic Marine Pulses (AMP) model (Moore et al., 2018) as well as ongoing efforts to model biological benthic hotspots and key drivers that maintain the benthic hotspots in the region (Feng et al., 2018). Lovvorn et al. (2018) also recommend the development of models linking hydrographic patterns to lateral advection of phytodetritus and the descent of this material to the benthos as recorded in sediment organic carbon, which may allow the use of physical climate models to project the future expansion of benthic habitats for use by benthivorous predators.
Fieldwork during the 2018 season indicates significant new accelerated declines in annual sea ice persistence, earlier sea ice breakup, and later sea ice freeze-up in the Pacific Arctic, along with warming bottom waters, particularly in the SLIP region in the northern Bering Sea (Box 1). These very recent developments pose the inevitable question as to whether the benthic ecological system has reached a tipping point that will result in a reorganization and shift in the productivity of the rich northern Bering Sea. Clearly, the system requires further study, and the dramatic shift in 2018 supports the need for continued time series studies of both water column and benthic biological parameters along with a broad suite of environmental measurements. Continuation of the biological time series will help facilitate change forecasting and will also help to determine whether the long-hypothesized shift from the dominance of benthic to pelagic systems in the Pacific Arctic is underway.