Introduction
The National Science Foundation’s (NSF’s) Ocean Observatories Initiative (OOI) is a source of open access, continuous, long-term digital data that stream from a suite of co-located instruments measuring physical, chemical, geological, and biological properties at multiple locations in the world ocean (Smith et al., 2018; Trowbridge et al., 2019). These data, made publicly available in real time, constitute a valuable resource that undergraduate educators can use to teach a range of oceanographic principles and make the scientific process tangible. Using real data in undergraduate science education offers significant benefits for developing students’ analytical and problem-solving skills (e.g., Gougis et al., 2017; O’Reilly et al., 2017; McDonnell et al., 2015).
Here, we describe existing educational resources derived from OOI data that can be leveraged for undergraduate teaching activities and give example applications of these resources in lesson plans and research experiences for undergraduates. Our goal is to help guide educators in determining appropriate OOI data sets and applications for their own needs. Though this paper focuses on undergraduate geoscience education, the resources and example applications introduced could be expanded to include other levels such as K–12 education and graduate student research opportunities.
Background
Engaging students in active learning by modeling the scientific process using real-world data is a high-impact educational practice (Rubin and Abrams, 2015; O’Reilly et al., 2017; Soule et. al., 2018; Deslauriers et al., 2019). Data explorations allow students to engage in academically complex and challenging activities that require conceptual thought through the validation of physical models (Resnick et al., 2018) and the procedural knowledge needed to produce an analytical result (Kastens et al., 2015). Working with real data allows students to conduct inquiries that model the actual process of science, facilitating knowledge retention and development of more sophisticated cognitive skills (Krathwohl, 2002; Bybee et al., 2006), as outlined in Bloom’s taxonomy (Bloom et al., 1956; Krathwohl, 2002). When students analyze data, create figures, and explain their interpretation of the data, they must apply broader scientific principles to their observations, thereby engaging at a higher level on Bloom’s pyramid (Gougis et al., 2017; Massimelli et al., 2019).
Though students may initially be challenged by the “messiness” of real data (Ellwein et al., 2014), as they gain confidence with the mechanics of data analysis, they can use authentic, open access data sets to independently solve complex, unstructured questions (Carey et al., 2015; Kastens et al., 2015) and improve their understanding of the nature of science and the limitations of any data set (Lederman, 1992). Data-driven activities can also encourage peer learning through small group work (Springer et al., 1999; Thomas and Brown, 2011; Brame and Biel, 2015; Toven-Lindsey et al., 2015) and cultivate data skills needed for future careers in academic and workplace environments (Langen et al., 2014; Rubin and Abrams, 2015; Carey and Gougis, 2017). Even the use of a single data-driven activity can result in students being more comfortable dealing with large data sets and becoming more quantitatively literate (Klug et al., 2017) as well as more competent in manipulating data in a spreadsheet (O’Reilly et al., 2017).
Despite the well-documented link between data-focused lessons and development of higher-level cognitive skills, data-focused activities are often lacking in undergraduate curricula (Brewer and Gross, 2003; Michener and Jones, 2012; Carey et al., 2015; Rubin and Abrams, 2015). Some models for teaching effectively with authentic data in the undergraduate classroom do exist within the geoscience education community and have been found to increase knowledge retention and self-efficacy (e.g., Teasdale et al., 2015). A number of activities and resources are available through the Science Education Resource Center’s (SERC) Teaching with Data portal (https://serc.carleton.edu/sp/library/twd/). The InTeGrate (Interdisciplinary Teaching about Earth for a Sustainable Future; https://serc.carleton.edu/integrate/) program uses data and systems thinking to engage students in interdisciplinary problem solving. Project EDDIE (Environmental Data-Driven Inquiry and Exploration; https://serc.carleton.edu/eddie/) consists of a suite of flexible classroom teaching modules that use large, publicly available Science, Technology, Engineering, and Math (STEM) data sets to engage students in quantitative reasoning. Examples also exist within the field of oceanography, including resources for K–12 (e.g., NOAA Data in the Classroom, https://dataintheclassroom.noaa.gov/) and undergraduate level (e.g., Hands-On Oceanography, https://tos.org/hands-on-
oceanography; MARGINS Data in the Classroom, https://serc.carleton.edu/margins/; and Ocean Tracks http://oceantracks.org/curriculum/undergraduate). However, there is a need for further development of activities involving authentic data that cross the subdisciplines of oceanography, and OOI’s unique infrastructure of co-located instruments provides such a resource.
The Ocean Observatories Initiative
The OOI is a large NSF research facility designed as an open resource for ocean scientists, with the goal of providing long-term observational data from several contrasting oceanic regimes (Smith et al., 2018). One key OOI element is freely available online posting of data (Smith et al., 2018) that provides an open opportunity to examine continuous, long-term, high-resolution data sets through its Data Portal and other websites (Table 1, Vardaro and McDonnell, 2018). Data collected by the OOI have been publicly available since the project was commissioned in late 2015 (https://oceanobservatories.org/2016/01/ooi-status-update-january-08-2016/).
The OOI infrastructure (https://oceanobservatories.org) consists of seven instrumented arrays located in the coastal and open oceans of the North and South Atlantic and Pacific (Figure 1). Arrays consist of instrumented moorings, autonomous underwater vehicles, and seafloor observatories that measure physical, chemical, geological, and biological properties and processes from the seafloor to the air-sea interface. Moorings contain instruments deployed on a variety of platforms, including surface buoys and wire-following profilers, as well as fixed instruments deployed at discrete depths along the mooring cable and on the seafloor (Smith et al., 2018). These instruments capture a range of ocean properties (e.g., salinity, temperature, density, dissolved oxygen, fluorescence, nitrate, optical backscatter, pH, pCO2) on a variety of temporal and spatial scales. Sensors are distributed throughout the water column and cover a range of geographic areas contrasting coastal with open ocean and polar with temperate ocean environments. Cabled seafloor observatories include deep and shallow profiler moorings; video cameras; hydrophones; benthic heat, fluid, and methane flux instruments; seismometers; tiltmeters; and a host of other bottom-mounted instruments that provide real-time data designed to capture activities near methane seeps, hydrothermal vents, and a seafloor volcano.
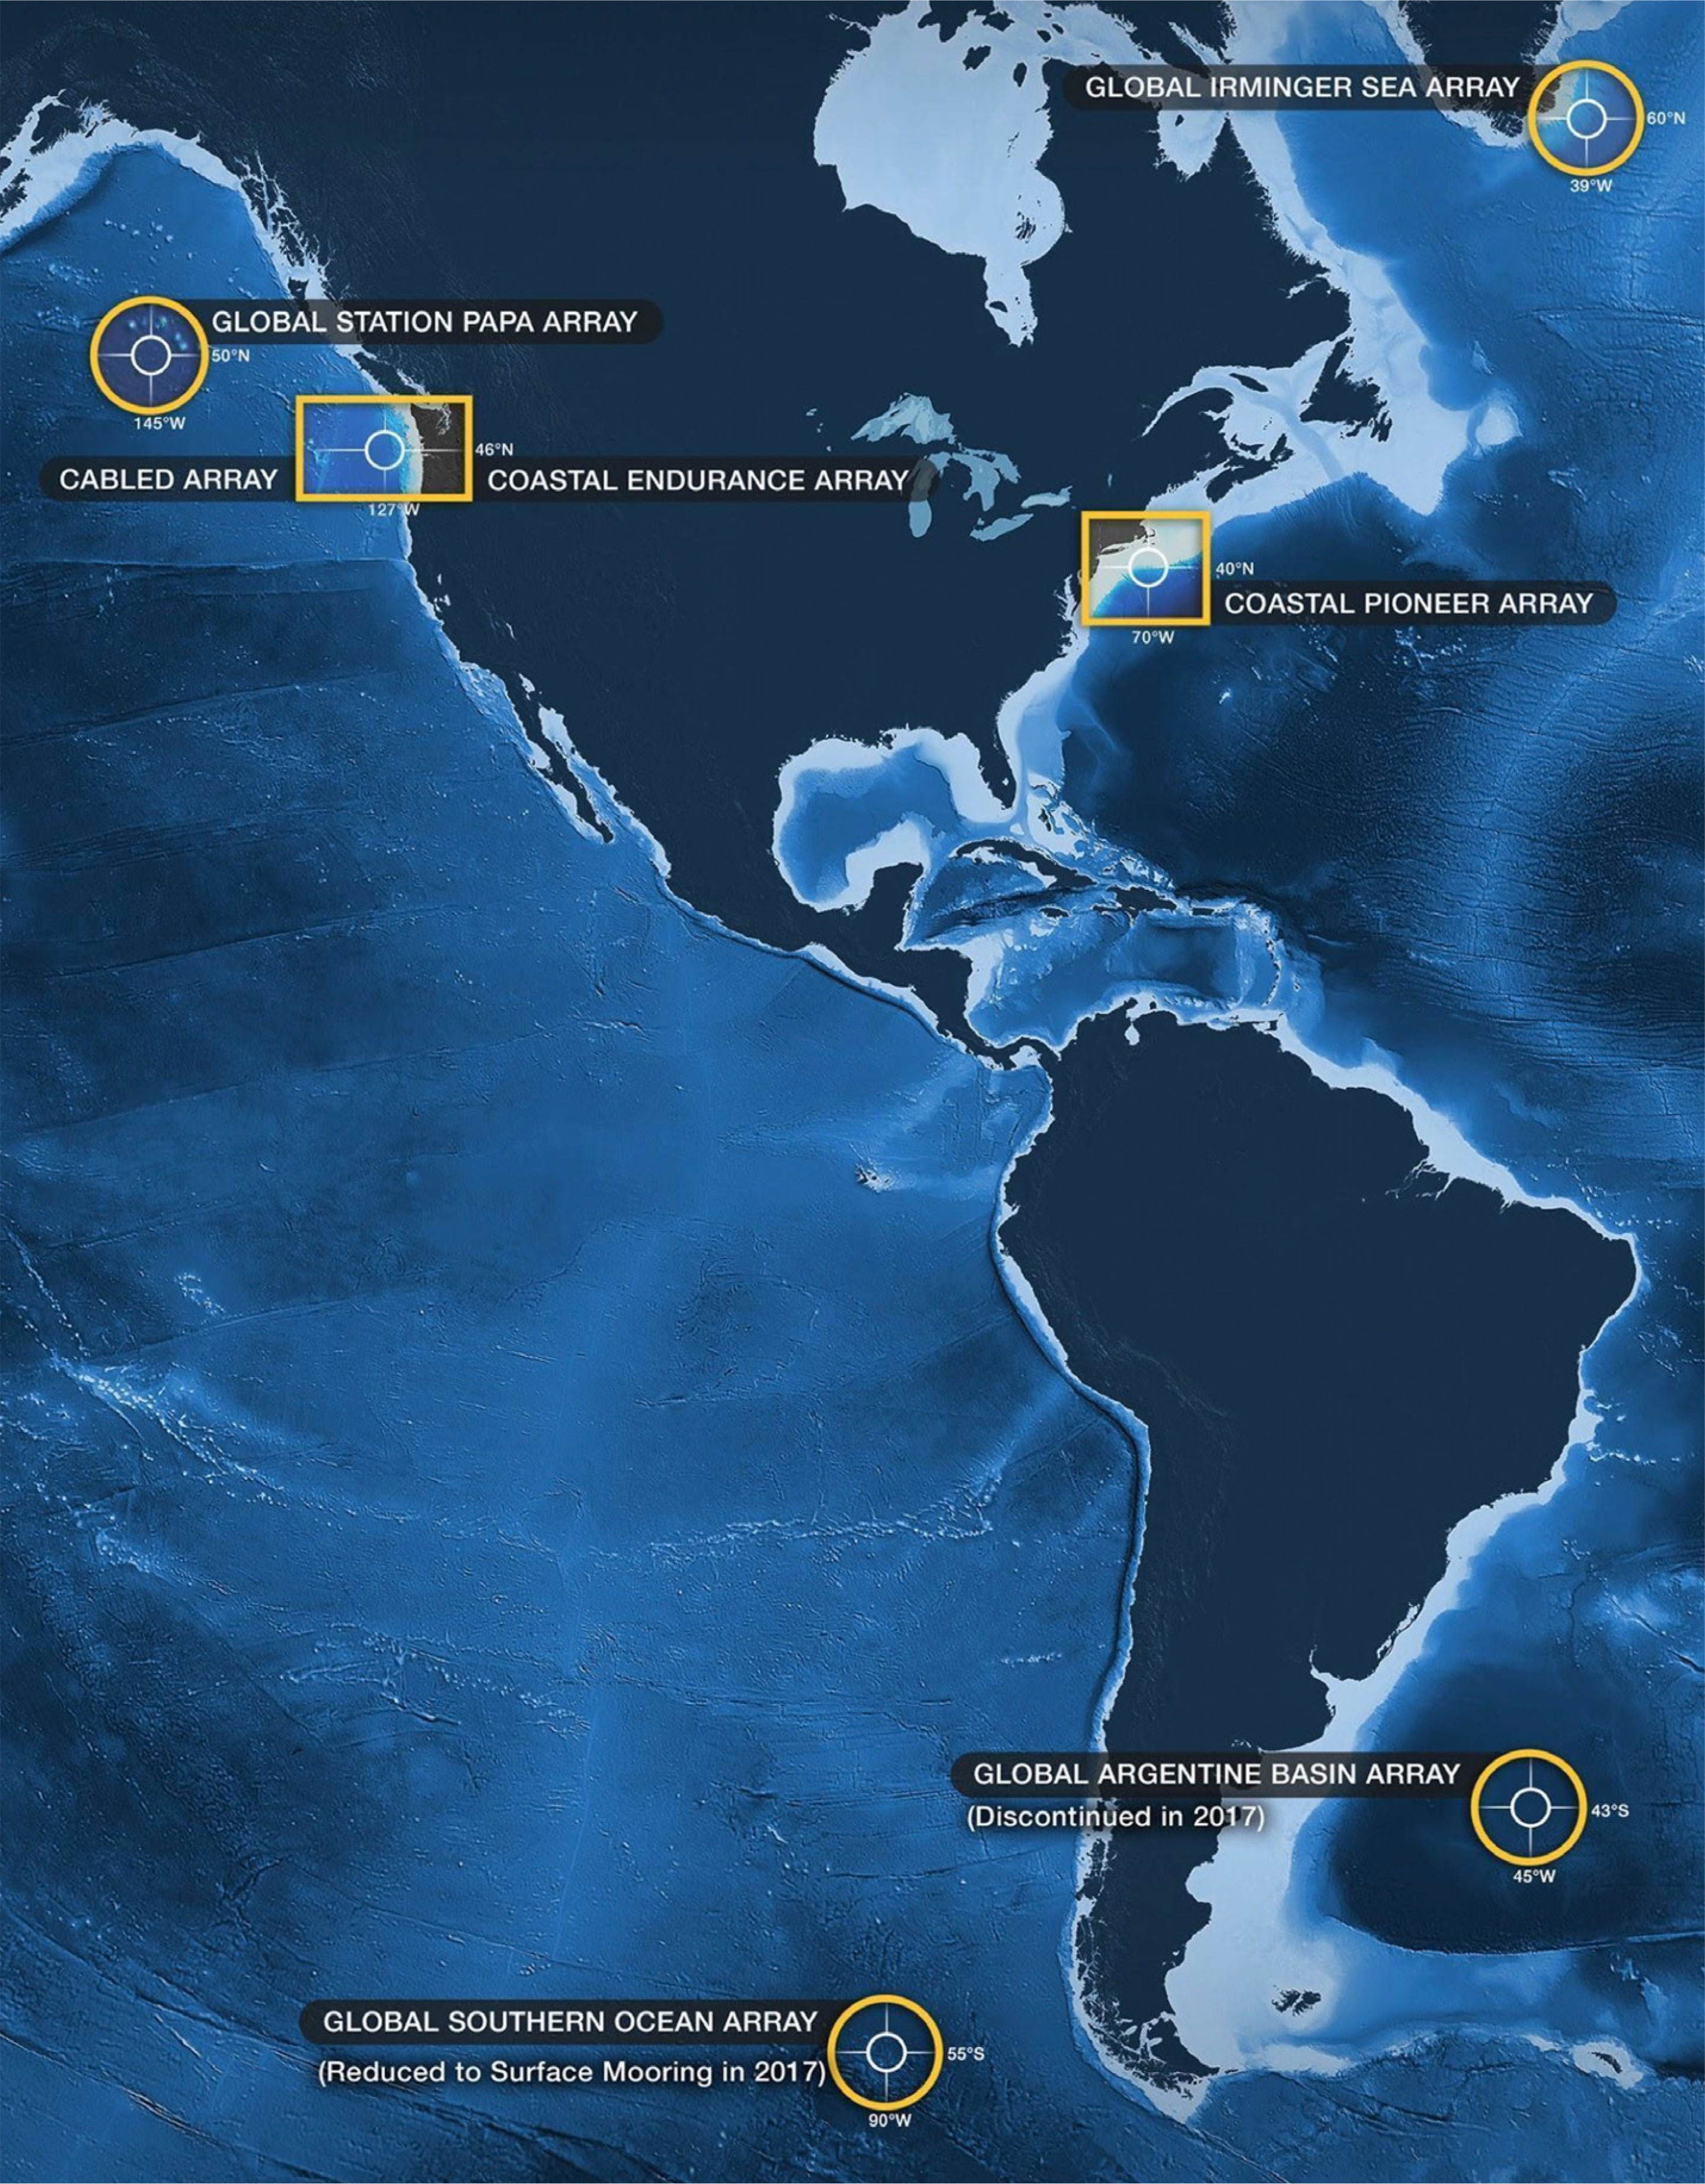
Figure 1. Map of Ocean Observatory Initiative (OOI) array locations. Credit: OOI Cabled Array program & the Center for Environmental Visualization, University of Washington. > High res figure
|
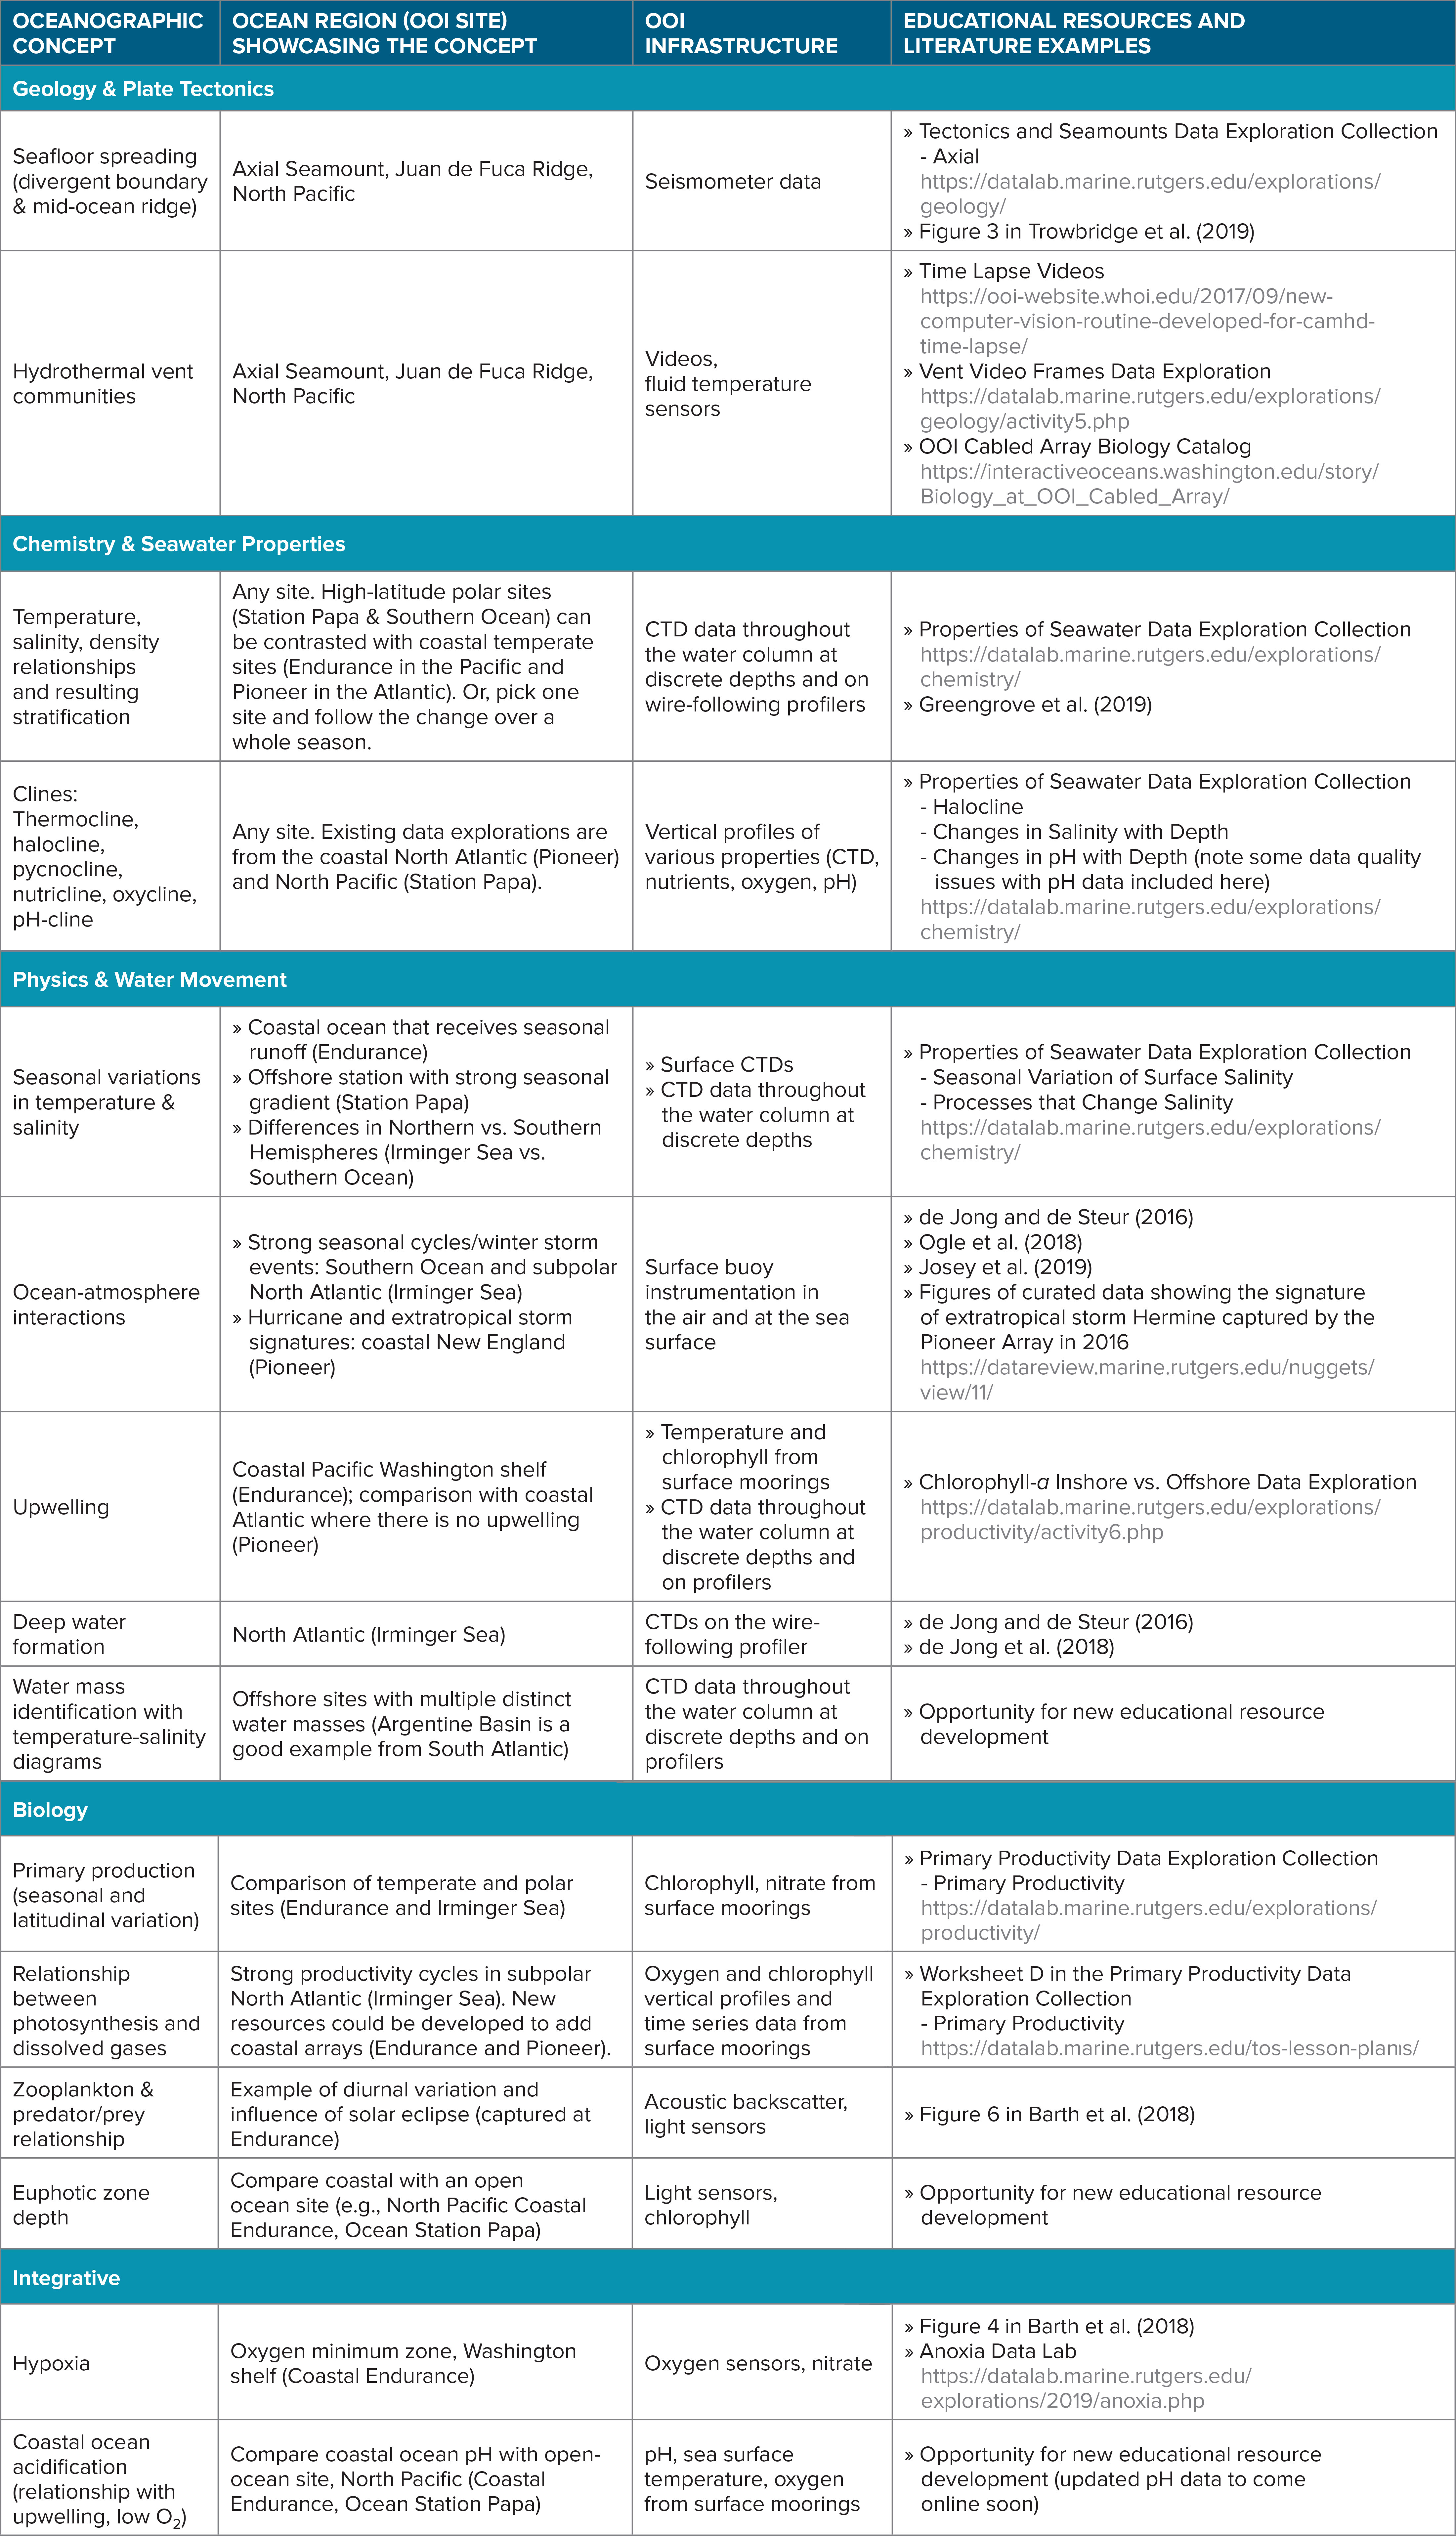
Observations from the OOI can be used to explore myriad Earth system processes (Trowbridge et al., 2019), such as undersea volcanic eruptions (Wilcock et al., 2018), methane hydrates (Philip et al., 2016), earthquakes (Tréhu et al., 2018), coastal hypoxia (Barth et al., 2018), heat budgets (Chen et al., 2018), warm core rings (Gawarkiewicz et al., 2018), global ocean-atmosphere exchange processes (Ogle et al., 2018), and the oceanic biological pump (Palevsky and Nicholson, 2018). Real-time OOI data streams not only provide an effective resource for improving ocean literacy (Adams and Matsumoto, 2007, 2009) and bring to life many important concepts taught in ocean and Earth science classes (Table 2), they also represent an opportunity for the oceanographic community to expand the reach of its science into classrooms.
Table 2. Concepts commonly covered in oceanography classes that could be addressed using OOI data. The goal of the table is to identify concepts to which OOI data are applicable and resources illustrating these concepts that already exist in the form of classroom-ready interactive data exploration tools and published papers. Many of the classroom-ready activities are aimed at the introductory level, but in many cases these concepts can also apply to upper level and graduate courses when explored in greater detail and complexity. The table also highlights several opportunities for future educational resource development that could further leverage the potential of OOI data in undergraduate classrooms. > High res table
|
From the outset, supporting undergraduate educational efforts was part of the OOI design (OOI Final Network Design, https://oceanobservatories.org/planning-history/final-network-design/). During construction of the OOI, a small team within the project was dedicated to developing educational resources and tools to complement the scientific and engineering aspects of the program and provide a gateway for educators to use OOI data (McDonnell et al., 2018). A later effort, Data Explorations, curated and condensed several key data sets from the OOI database into easily accessible interactive data “widgets”—interactive data visualizations (e.g., Figure 2a)—to support data-based learning activities for undergraduates in oceanography (Tables 3 and 4). These widgets were reviewed and successfully implemented by 20 educators in introductory oceanography courses at the undergraduate level (Hunter-Thomson et al., 2017). The OOI Data Labs project (https://datalab.marine.rutgers.edu/) is the contemporary extension of the Data Explorations project; it has expanded the initial set of explorations to over 30 curated online interactive data activities and actively seeks to engage the education community (https://datalab.marine.rutgers.edu/join-our-community/).
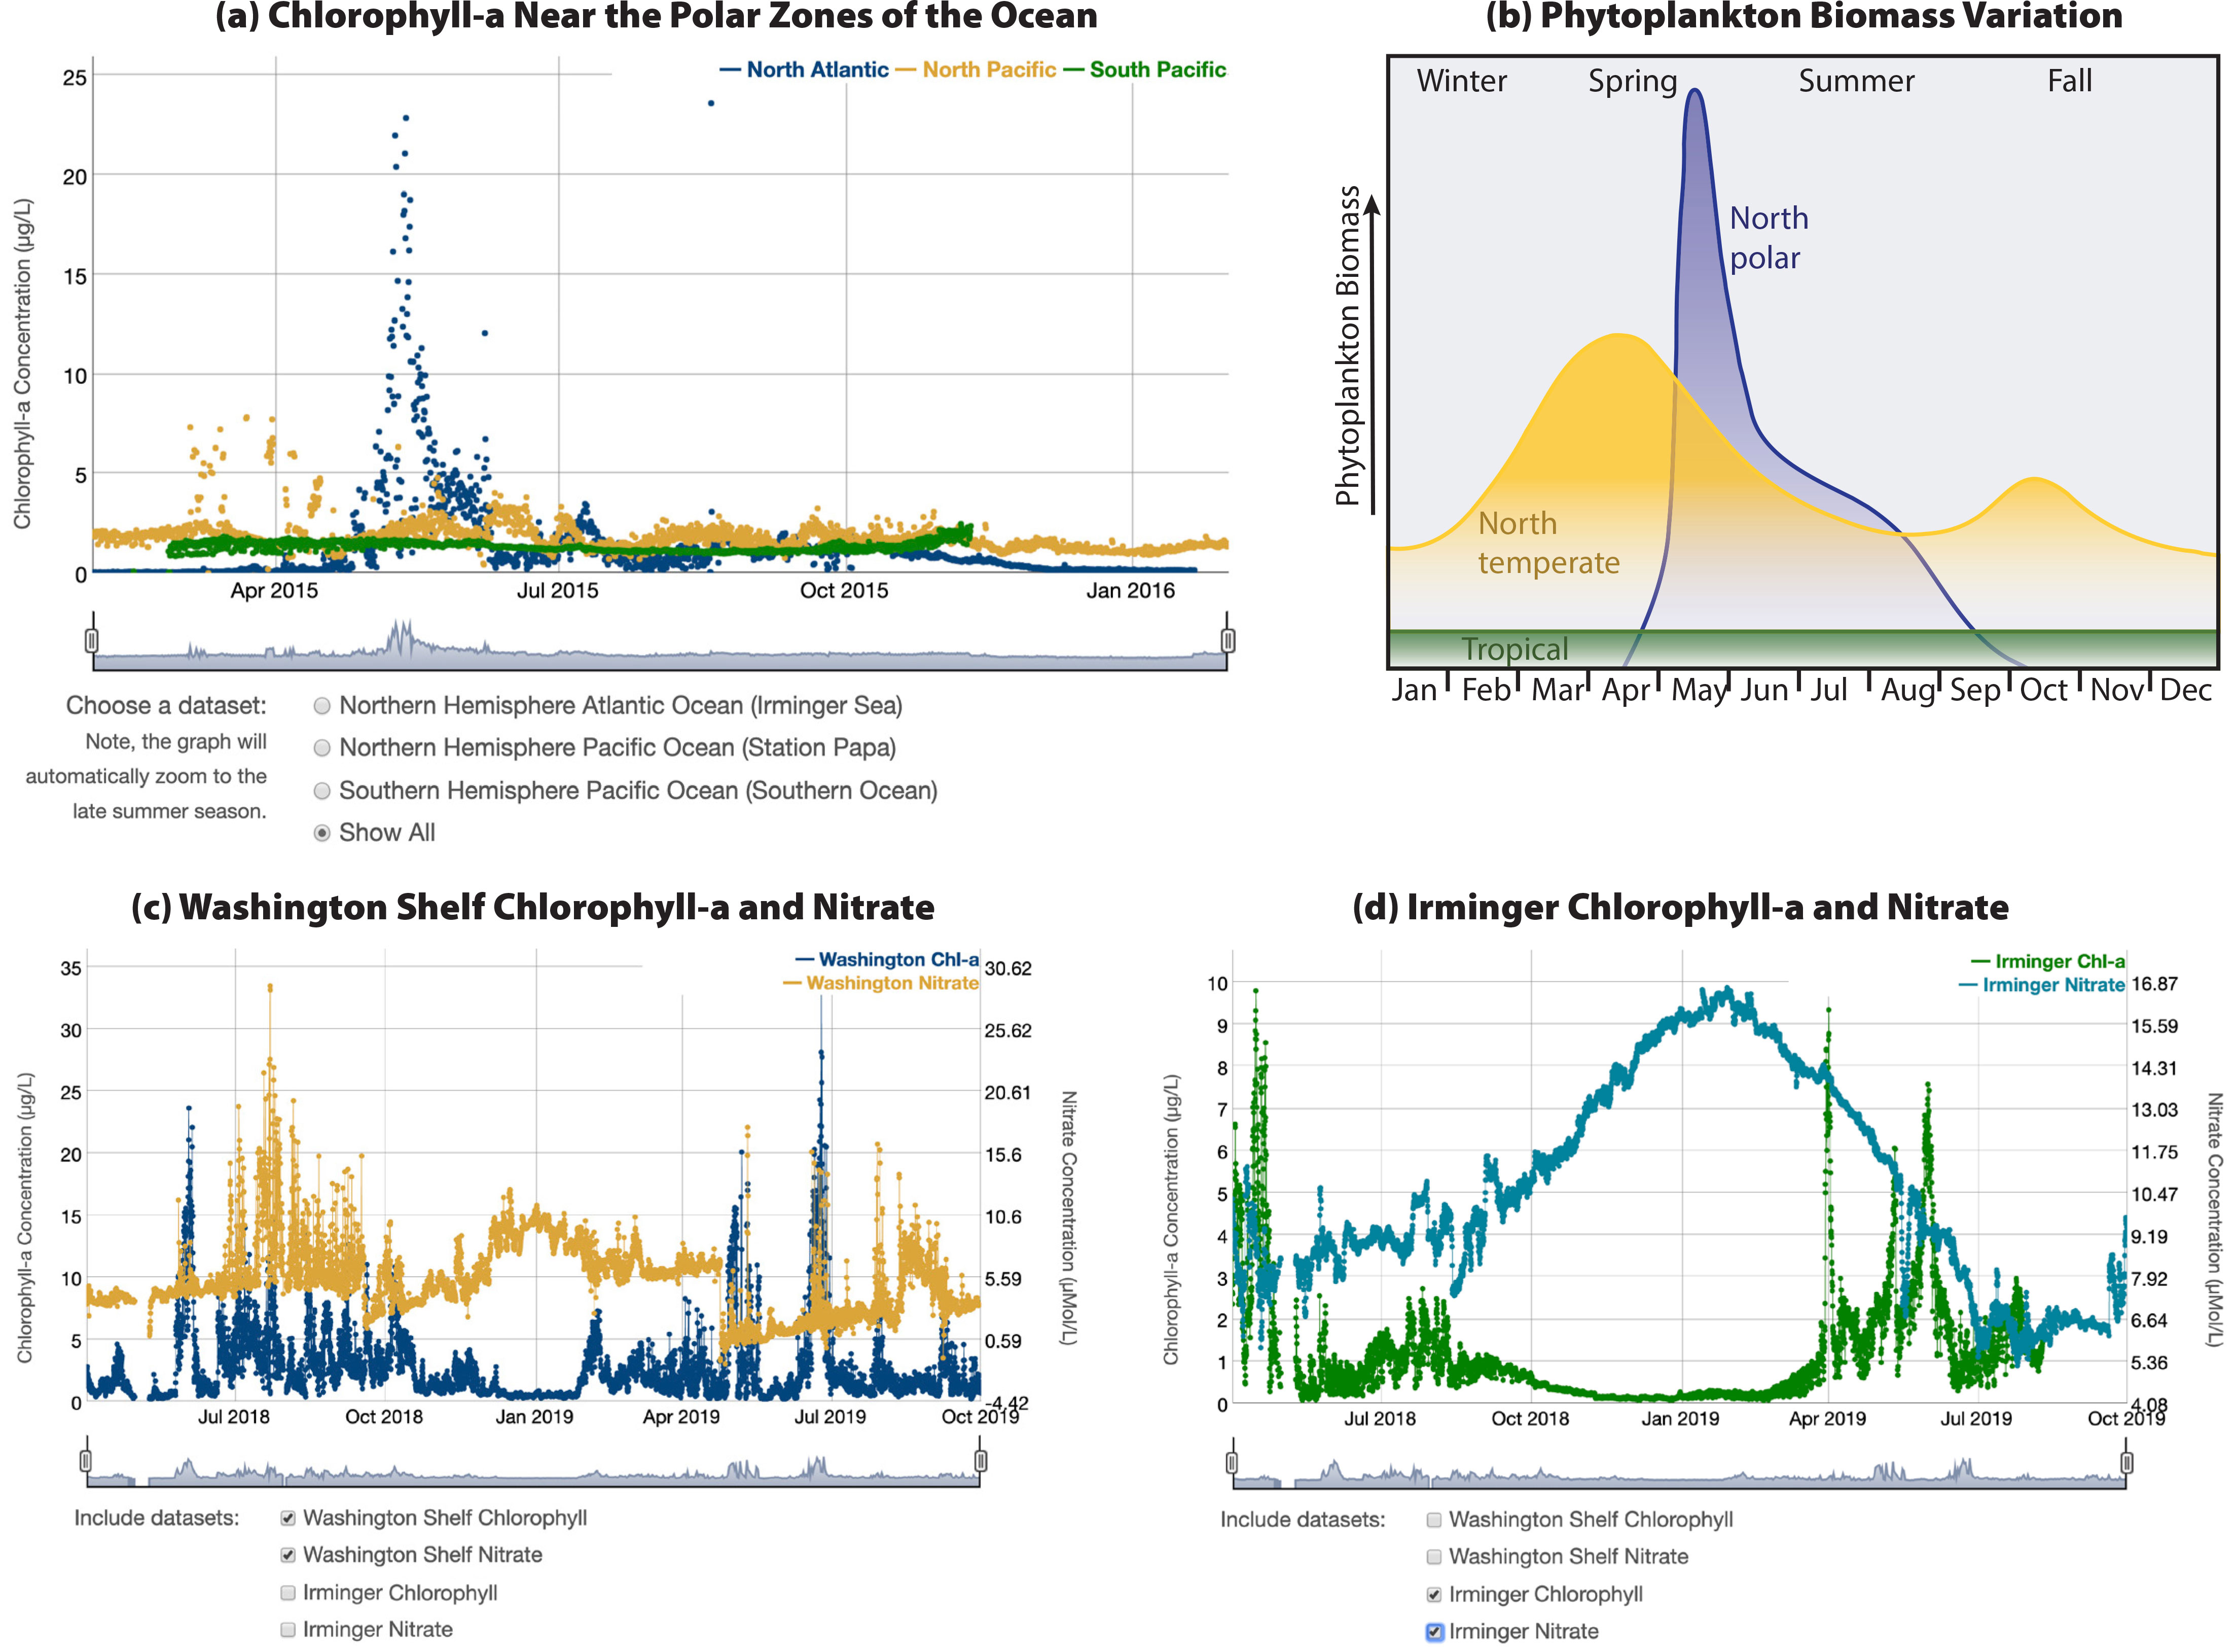
Figure 2. (a) Screenshot of the basic chlorophyll data exploration widget (https://datalab.marine.rutgers.edu/explorations) for three different polar ocean regions. (b) Classic textbook-like figure of phytoplankton biomass variation with latitude. (c,d) Screenshots for a similar exercise with increasing complexity, comparing chlorophyll and nitrate data from temperate and polar oceans. > High res figure
|
Table 3. Examples of existing and emerging resources for using OOI data in education. > High res table

|
Challenges of and Opportunities for Using OOI Data and Resources in the Classroom
Because of the size and diversity of its data, the OOI has the potential to provide a rich resource for educators to bring the ocean into the classroom. There are several challenges associated with using OOI data, however, that extend beyond the general challenges of using data in the classroom. First, the OOI arrays have been deliberately located in complex oceanographic settings with high spatial and temporal variation (Trowbridge et al., 2019). Therefore, the data often do not replicate simplified textbook examples. While this is a challenge, it is also an opportunity for educators to use the data to communicate to students the dynamic nature of the ocean and the complex interplay of various processes. Second, as scientists, we understand that gaps in observational data are unavoidable, but students may struggle with how to interpret missing data or how to reconcile and analyze an incomplete time series. This again can provide an opportunity to discuss the challenges of ocean observation, such as biofouling or the need for instruments to withstand intense winter conditions at high latitudes, that may have caused these gaps. Lastly, perhaps the biggest barrier to educational use of OOI data is that the current system is designed to deliver data in near-real time, which means minimal processing and quality control are done before the data are posted online (Table 1). Therefore, using data from the current OOI data archive in an introductory undergraduate classroom requires an initial time investment to select appropriate and available instruments, download data, verify their quality, and manipulate them into usable formats.
Though instructors and students with more advanced experience can make meaningful use of the data directly accessed from OOI data portals (Table 1), the initial effort required to learn the system and manipulate the data can provide an entry barrier for many instructors. Fortunately, along with the Data Labs project, there is a growing online community of educators who have created and shared their curated OOI data sets, tools, and lesson plans for others to use (Table 3). These curated data sets and online interactive widgets allow even introductory students to engage with these data sets in meaningful ways. As the OOI community continues to grow, we anticipate more data sets and activities will become available.
Example Applications
To demonstrate the value of curated OOI data sets for education, we highlight example applications for introductory oceanography courses and for student research projects that have been pilot-tested by several authors of this paper.
Classroom Activities
The example classroom activities make use of existing interactive online Data Explorations (Table 4) and associated lesson plans and student worksheets that are available online (https://datalab.marine.rutgers.edu/tos-lesson-plans/). The activities are designed to take information introduced through lectures or textbook readings that engage students at the foundational levels of remember and understand and facilitate student engagement with the more sophisticated apply, analyze, and evaluate cognitive skill levels of Bloom’s taxonomy (Bloom et al., 1956; Krathwohl, 2002). Each set of activities and tools can be applied in a variety of class sizes and learning environments (Soule et al., 2018) to achieve a range of content and skill-development objectives. Adaptations can be made as well to use these activities in remote (homework or online) settings that do not have real-time instructor interactions. If access to a computer lab is not available, widgets can be implemented using personal laptops, tablets, or even smartphones. Ideally, students work in small groups with the graphs on a shared screen to optimize interactivity, but the graphs can also be displayed on a projection screen or printed in hard copy if necessary. Although the examples presented here have specific classroom settings, the curricular materials utilized are flexible and can be adapted to meet diverse course needs.
Controls on Primary Productivity
Primary production in the ocean links ocean biology to atmospheric composition, ocean circulation, continental run-off, the global carbon cycle, and the geological record. Chlorophyll concentration, though a measure of phytoplankton biomass rather than a direct measure of the rate of production, is often used to study primary production. Key insights into primary production dynamics in the ocean are provided by examining changes in chlorophyll concentration in different geographic settings on various temporal scales (daily, seasonally, interannually) and analyzing how production limiting factors are related to these concentrations. OOI arrays are located in areas where primary productivity is controlled by a range of limiting factors often discussed in textbooks (e.g., Figure 2b). The Irminger Sea Array, for example, shows a strong signal of seasonal light limitation, while the Endurance Array on the Washington Shelf showcases the effects of upwelling. Other oceanic regions that can be compared are Pacific versus Atlantic, inshore versus offshore, Northern versus Southern Hemisphere, and polar versus temperate biomes.
Classroom activities were conducted based on several interactive data widgets in the OOI Data Labs Primary Production collection (Table 4, Figure 2a) in both 100- and 200-level Introduction to Oceanography courses across three institutions—a small liberal arts college, a regional public university, and a research-focused university. The class sizes ranged from fewer than 20 to more than 100 students and included both science and non-science majors. The students used chlorophyll time series from several OOI arrays to investigate variability in primary production. They completed a guided data analysis exercise to explore and answer questions about chlorophyll data—such as identifying phytoplankton biomass maxima, minima, time periods, and seasonal variations—collected from surface moorings in different geographic settings, including the subpolar North Atlantic (Irminger Sea Array), eastern subarctic North Pacific (Station Papa Array), Washington shelf upwelling (Endurance Array), and eastern Pacific sector of the Southern Ocean (Southern Ocean Array). They were asked to identify patterns in realistic chlorophyll data that relate to primary production cycles, describe geographic and seasonal variations in phytoplankton biomass and primary production rates, and apply prior knowledge of limiting factors (nutrients, light, stratification) to develop hypotheses about primary production in different ocean regions. Lesson plans and materials for each application (https://datalab.marine.rutgers.edu/tos-lesson-plans/) provide further details regarding the variation in use across these educational contexts.
Student learning goals for the primary productivity activity span several cognitive skill levels:
- Reinforcing and reviewing concepts previously covered in lecture and/or homework assignments, identify, describe, and explain the dynamics of and controls on primary production in different ocean regions throughout the year (Bloom’s cognitive process: understand).
- Analyze and interpret “messy” real data rather than a highly conceptualized textbook figure (Bloom’s cognitive process: apply).
- Identify and interpret figure axes and relationships among different parameters and formulate and test hypotheses (Bloom’s cognitive processes: apply and analyze).
- Identify limiting factors and formulate hypotheses about primary production in different regions of the ocean (Bloom’s cognitive processes: evaluate and create).
Instructors may build on this example activity for use in more advanced classes. For example, additional auxiliary measurements can be used to expand physical and biogeochemical contexts; these might include salinity, temperature, nitrate, oxygen, optical backscatter, and colored dissolved organic matter. Extension activities incorporating advanced concepts were integrated into different versions of this activity across the three institutions, including: (1) examination of covariance between chlorophyll and nitrate (Table 4, Figure 2c,d), (2) exploration of physical and biogeochemical factors influencing bloom dynamics across three high-latitude ocean regions, and (3) a jigsaw activity using static graphs of data from the Irminger Sea Array (Palevsky and Nicholson, 2018) to compare trends in temperature, chlorophyll, and dissolved oxygen over the seasonal cycle. Instructors can also expand beyond these developed materials by adding a discussion of ocean engineering and challenges of obtaining sustained time-series data across the range of locations, leveraging examples of missing data as learning opportunities.
Submarine Volcanism – Axial Seamount
Plate tectonic processes are commonly taught in introductory ocean and Earth science classes but can be an abstract concept for students. The OOI Regional Cabled Array Axial Seamount site, located on a divergent plate boundary, is home to the most magmatically active volcano on the Juan de Fuca Ridge (Chadwick et al., 2016). Seafloor eruptions were directly observed at Axial Seamount in 1998 and 2011, and an eruption was recorded in real time by OOI instruments in 2015. All three eruptions occurred at a predictable level of seafloor inflation and, based on current inflation rates, we expect another eruption at Axial before 2022 (Wilcock et al., 2018). This set of circumstances creates a unique opportunity to study the relationship between different geophysical parameters over the course of an eruption.
A classroom activity using interactive graphs in the OOI Data Labs Exploring Tectonics & Seamounts collection (Table 4) was conducted in an Introduction to Oceanography lecture class of 35 students at a regional public university (https://datalab.marine.rutgers.edu/tos-lesson-plans/) to help students better understand the complex geophysical dynamics of volcanic eruptions. After a brief introduction to the tectonic setting and eruption patterns of the volcano, students were directed to investigate geological features of the seamount by viewing graphs of seafloor depth and x- and y-axis tilts at three locations before and after an April 2015 eruption. In order to help them navigate the three-dimensional spatial reasoning required to interpret these graphs, students were directed to kinesthetically represent the change in tilt of the seafloor by tilting a flat surface, such as a textbook. Students then applied their knowledge of eruption patterns to the record of caldera inflation and, using an eruption threshold, made a prediction of the timing of the next eruption.
Goals for student learning for the submarine volcanism activity span several cognitive skill levels:
- Describe the connection between divergent plate boundaries and volcanic seamounts (Bloom’s cognitive process: understand).
- Interpret graphs and kinesthetically visualize three-dimensional changes in the seafloor (inflation and tilt) from time-series graphs (Bloom’s cognitive processes: apply and analyze).
- Formulate a prediction for the next eruption based on seafloor inflation trends (Bloom’s cognitive process: evaluate).
This activity can be extended to serve the needs of an upper-level class by including data science, time-series skills, statistical skills, or upper-level geophysical content. Depending on students’ level of computational skills, they can be asked to plot the bottom pressure and tilt time series instead of using a pre-constructed graph or be tasked with downsampling the data to remove the tidal signature. Advanced students can use regression analysis to calculate inflation rates between eruptions to identify changes in slope. The time series can also be compared to pre-processed seismic data available online from William Wilcock (http://axial.ocean.washington.edu/) to calculate earthquakes per day, allowing students to visually identify the relationship between changes in inflation rate and changes in the amount of daily seismicity (Natalie et al., 2018).
Salinity and Stratification
Salinity and temperature determine density and affect stratification and mixing in the ocean, as well as drive thermohaline circulation. OOI data provide the opportunity to examine and compare real-world salinity in different coastal and open ocean regions over a range of timescales and throughout the water column with data from hundreds of CTDs deployed across the arrays. An activity using the OOI Data Labs salinity-related widgets was implemented in an Introductory Oceanography lab on two campuses of a public university: a small (n = 22) lab class at a small teaching-focused campus, and a large (n = 150), multi-section lab class at a large research-focused campus. The activity explored the effects of temperature and salinity on density and stratification in the ocean.
After initial hands-on interactive demonstrations of the relationship between temperature, salinity, density, and stratification, students were asked to investigate processes that affect salinity (e.g., seasonal variations, changes with depth, geographic location) using the salinity data exploration widgets (Table 4). Explorations included (1) comparing time series of air temperature, surface salinity, precipitation, evaporation, and rain rate at a coastal site in the northern Pacific Ocean (Coastal Endurance Array) to examine changes, patterns, and trends, and (2) comparing seasonal variations in surface salinity data across coastal and open-ocean regions and with depth. Students were asked to provide explanations for their observations by discussing the processes that appeared to affect salinity, as well as how and why salinity changed over time in different regions of the ocean. Lesson plans and worksheets can be found online (https://datalab.marine.rutgers.edu/tos-lesson-plans/).
Student learning goals for the salinity and stratification activity span several cognitive skill levels:
- Explain the relationship between temperature, salinity, density, and stratification (Bloom’s cognitive process: understand).
- Interpret time series and profile data visualizations and explain the changes in salinity and stratification (Bloom’s cognitive processes: understand and apply).
- Compare and contrast salinity across geography, season, and depth (Bloom’s cognitive processes: analyze and evaluate).
This activity can be extended for upper-level classes by having students directly access real-time salinity data, for example, through the OOI Regional Cabled Array Data Portal (Table 1) in addition to using the online widget. For more advanced classes, students can download temperature, salinity, and density profile data to (1) plot vertical profiles at various locations for different seasons to compare stratification, (2) make contoured sections of these water properties over time, and/or (3) conduct water mass analyses using T-S plots.
Beyond the Classroom: Using OOI Data in Undergraduate Research Projects
The wealth of publicly available OOI data also provides opportunities for students to engage beyond the classroom by using these data in undergraduate research projects. There is abundant evidence that early undergraduate research (Thiry et al., 2012), supplemental instruction (Villarejo et al., 2008), and faculty partnerships (Nagda et al., 1998) can be transformative for undergraduates, especially those from underrepresented populations (Nagda et al., 1998; Russell et al., 2007). These experiences foster enhanced scientific thinking, increased confidence conducting research, greater enthusiasm for science, and real-world experiences advantageous for graduate school or private-sector job applications (Hunter et al., 2007). Additionally, projects engaging students in independent research enable them to work at the top levels of Bloom’s taxonomy (cognitive processes: evaluate and create), synthesizing prior learning to evaluate hypotheses and create new knowledge (Krathwohl, 2002).
Utilizing free online data sets such as those offered by the OOI opens opportunities for cutting-edge, authentic oceanographic research experiences without requiring access to the resources of a large research institution. Students and faculty advisors can access the data from anywhere through the data portal and process the data on personal computers. If a project requires high processing power, there are cloud computing resources (e.g., Google Colab, Pangeo) that are now free to anyone online. The wide range of available data from the OOI allows a faculty mentor to tailor projects according to a student’s skills, interests, and time availability. All that is required is data science skills, an idea that can be addressed within the scope of the available data streams, and a willingness to engage.
Since OOI data first became publicly available in 2015, undergraduates have conducted OOI-based research in a wide range of institutional settings. Some of these are traditional oceanographic institutions, for example, Woods Hole Oceanographic Institution, the University of Washington (UW), and Scripps Institution of Oceanography (Philip et al., 2016; Ogle et al., 2018; Zhang and Partida, 2018). Others are less traditional oceanographic settings, such as Millersville University, a landlocked public university in central Pennsylvania (Alexander et al., 2018); Wellesley College, an undergraduate-only women’s liberal arts college (Wanzer and Palevsky, 2018); and Queens College, an urban, minority-serving institution (Rahman et al., 2017; Pesar et al., 2018; Tesin et al., 2019; Sacker et al., 2019). Many student and early career projects have been highlighted through a feature series on the OOI website (https://oceanobservatories.org/tag/early-career-highlight/). These student projects have addressed a wide range of research topics, from air-sea heat exchange, to seafloor hydrothermal processes, to biologically driven carbon cycling, and in all cases engaged students in analyzing large data sets from a diverse range of oceanographic sensors.
As with classroom applications, one of the challenges in using OOI data for undergraduate research is that the data are delivered in raw or minimally processed formats and thus require scientific programming and data analysis skills in order to use them. To overcome these challenges, it is critical that faculty mentors scaffold their students’ data skill development by using increasingly more advanced activities that build on each other, starting with guided online tutorials and moving to more complex pair programming exercises to learn Unix, Python, R, and MATLAB coding. These challenges are also opportunities for undergraduates to develop sought after programming skills valuable for their future careers.
In addition to creating opportunities for research through its online data, the OOI has created opportunities for diverse groups of undergraduates to gain hands-on research experience at sea, providing additional depth to data analysis-focused student research experiences. Seagoing experiences can be transformative for undergraduate researchers (Finley and McNair, 2013; Olson and Riordan, 2012), both for the opportunity to actively participate in fieldwork and for the chance to develop relationships with the scientists and engineers on board. One example is the UW-NSF funded VISIONS cruises (https://interactiveoceans.washington.edu/expeditions/) conducted by the University of Washington to provide annual maintenance to the OOI Regional Cabled Array. Since 2013, approximately 150 students from multiple academic institutions have been selected through an annual application process to participate in the cruise, resulting in myriad creative contributions (http://ooica.net/student-projects/) and several senior theses and presentations at national meetings by students who used sensor data from the Regional Cabled Array in their projects (e.g., Rahman et al., 2017; Pesar et al., 2018; Tesin et al., 2019).
Other OOI maintenance cruises have offered to host external researchers, including students, by posting opportunities through the UNOLS Cruise Opportunity Program (https://www.unols.org/unols-cruise-opportunity-program). Though these opportunities are primarily targeted at graduate students, it is conceivable that undergraduates could participate if accompanied by faculty advisors, providing another means for students to combine fieldwork with analysis of publicly available OOI data. For example, a total of four undergraduates participated in the annual OOI Irminger Sea Array cruises in 2018 and 2019 with supplemental support from an NSF Chemical Oceanography-funded project, providing each student with a first seagoing research experience (https://irmingersea.blogspot.com). More information on ways to engage with the OOI can be found in Ulses et al. (2018).
Discussion and Future Directions
The examples presented in this paper showcase how incorporating OOI data into teaching both oceanographic concepts and data analysis skills provides opportunities for students to develop complex cognitive skills at higher levels within Bloom’s taxonomy (Figure 3). Each classroom example has objectives for student learning that include both content—understand and remember (e.g., explaining the factors that lead to a spring phytoplankton bloom)—and skills—apply and analyze (e.g., determining when the spring bloom has begun by comparing multiple time series). Undergraduate research examples highlight integrated application of skills and synthesis of content across objectives—evaluate and create (e.g., conducting a novel analysis of multiple years of sensor data to determine the influence of the spring bloom on the ocean carbon cycle).
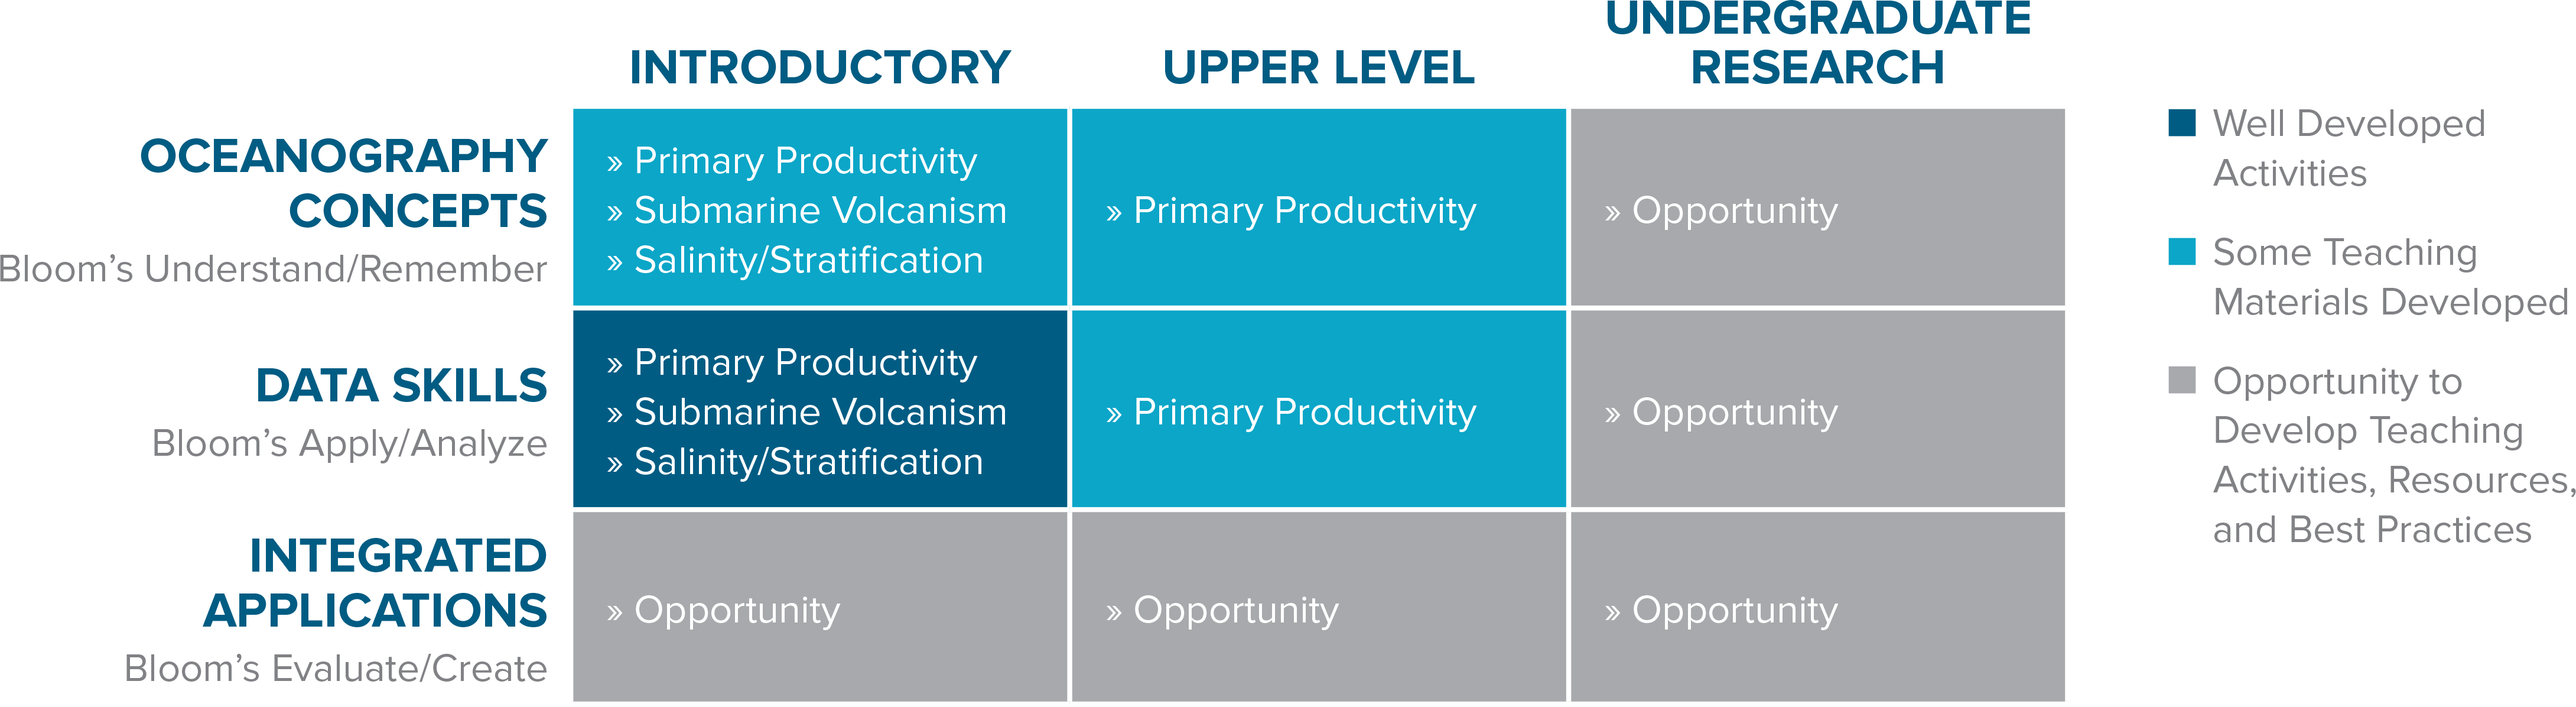
Figure 3. Matrix of OOI data-driven teaching activities mapped onto undergraduate course level (columns) and level of Bloom’s taxonomy (rows). Classroom examples used in this paper emphasize lower and middle Bloom’s levels in introductory course work with some material applicable to upper-level courses. Undergraduate research projects that incorporate higher-order data and application skills are also presented, but there remains an opportunity to develop shared best practices for engaging students in research using OOI data. There also remains a need for developing lessons geared toward upper-level courses and integrated applications at all levels. > High res figure
|
We are in the early stages of educational application and community development as the OOI ramps up its research program. As such, many gaps remain where there is potential to develop future educational applications (Figure 3). For example, there remains an opportunity to create and further develop existing educational tools and resources for upper-level undergraduate courses to support learning objectives at the higher cognitive skill levels (evaluate and create), focusing on open-ended data exploration. There is also an opportunity to develop transferable materials to assist faculty in the development of scaffolded data science skills needed to conduct undergraduate research projects with OOI data.
Studies have shown that integrating real-world data into undergraduate geoscience curricula will (1) enhance students’ understanding of concepts and make the material more accessible, and (2) build students’ aptitude and facility with graphing, analyzing, and interpreting data (Bader et al., 2016; O’Reilly et al., 2018). In order to know if the approach of the data-intensive classroom activities presented achieves these goals, it is critical to assess their effectiveness. A preliminary assessment of the Salinity and Stratification activity yielded no discernible difference in content knowledge between students who did this activity as compared to the previously existing hands-on lab on the same topic (Greengrove et al., 2019). Data analysis skill improvement, however, was not assessed. Additional assessment studies need to be carried out in order to determine the efficacy of these online widgets, as well as to develop a set of best practices using OOI data in introductory oceanography and other geoscience courses.
Our main purpose in writing this paper was twofold: (1) to provide the community with an overview of current OOI educational resources and opportunities, and (2) to provide a guide for entry points, avenues, and pathways for educators to get involved and join the community to develop, implement, and assess data-based educational resources. We encourage the community to create new and share existing curated data sets and adaptations as accessible alternatives to processing the raw data. This is an invitation for the community to dive in, build partnerships, and help plumb the depths of the OOI data set to find new and relevant ways to engage students with the data that can be shared as new activities to benefit educators and students at all institutions.
Acknowledgments
We would like to thank the reviewers of this paper for their constructive feedback, and also all those individuals who make the OOI program possible. We would also like to thank the Data Labs project (National Science Foundation Division of Ocean Sciences award #1831625) and the numerous educators who participated in that project’s workshops and widget and educational resource development, which contributed to bringing the authors of this paper together and to many of the example applications discussed here. Development of this paper has been primarily supported by National Science Foundation Division of Ocean Sciences award #1841799. Additional support was provided by National Science Foundation Ocean Sciences award #1946072.
Author Contributions
All authors contributed equally to writing this paper.